
Friday, September 17th, 2021
Happy Fabulous Friday!
I teach everyday people (like me) to trade options. I do my best to write in an understandable way as if we are talking over the kitchen table.
The Dow has been up two days and down one as I type on Wednesday. While the Nasdaq has been down three days, all the charts of the indices are down below the new highs they hit a couple weeks ago.
For today’s Trade of the Day, we will be studying Teck Resources Ltd. (TECK).
Teck Resources Limited engages in exploring for, acquiring, developing, and producing natural resources in Asia, Europe, and North America. It operates through Steelmaking Coal, Copper, Zinc, and Energy segments. The company’s principal products include steelmaking coal; copper concentrates and refined copper cathodes; refined zinc and zinc concentrates; energy products, such as bitumen; and lead and molybdenum concentrates. It also produces gold, silver, germanium, indium, and cadmium, as well as chemicals, industrial products, and fertilizers.
The company was formerly known as Teck Cominco Limited and changed its name to Teck Resources Limited in April 2009. Teck Resources Limited was founded in 1913 and is headquartered in Vancouver, Canada.
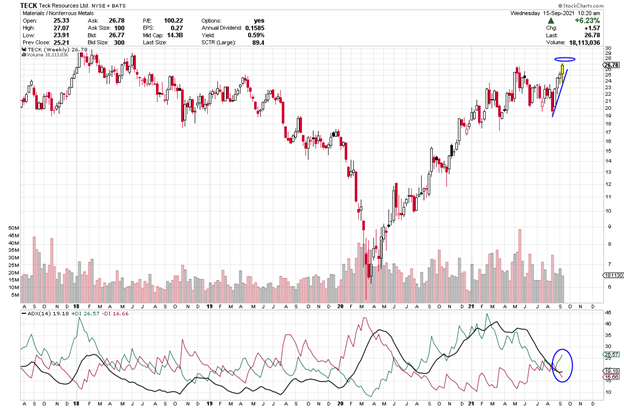
Let’s take a look at TECK’s weekly chart.
The ADX +DI (green line) is above the -DI and if it keeps heading up, the ADX line will starting to turn up. It looks as if it is just starting to turn. As long as the +DI is above the -DI, price should rise. Green above red is an indication of strength. When the +DI is bullish and the ADX turns up, it shows strength. If you want to learn more about ADX, read on or, if not, scroll down to the alert.

Average Direction Index (ADX) – Strength Indicator
The Average Directional Index consists of 3 lines: Green, Red and Black.
Green = +DI (Bullish)
Red = -DI (Bearish)
Black = ADX Strength Line
The DI line that is on top is in control. If the ADX line is heading up, strength is supporting the DI line that is on top and in control.
Check Out the Trade Alert Signal
Each candle on the chart represents price movement over a 5-day (week) period; therefore, it takes weeks for trades to play out. On the chart, the week is a bullish candle as I type. When the +DI crosses over the -DI line, it gives a buy signal (as the +DI line (green) appears as if it is in control and rising to head up on the ADX indicator, and as the ADX turns up that is even more bullish, suggesting an upward move is gaining strength. I’d like to see the green line to continue its upward bias and then the black line to continue turning up as well. It looks like it is starting to turn up and I hope it will continue. All are bullish signs of strength. When the +DI crosses the ADX (black line) and when it rises, it shows a new burst of strength coming into the equity.
The Black ADX line is a strength line and if it flips up and continues to head up, it shows strength, and we’ll know strength will continue to flow into this equity. We will keep an eye on TECK over the course of the next few weeks.
If TECK’s price moves above or stays above $27, you could consider a trade. The short-term price target for TECK is $28 and then, perhaps, higher. With the swings and recent volatility I am suggesting small profit targets until a market trend starts again.
TECK Potential Trade – Showing Strength
This signal could give a quick payout if it continues its upward move, and the strength of this pattern continues. It looks as if it could push above $28.
To buy shares of TECK would cost approximately $27 per share and if it reaches its near-term target of $28 that would be a gain of $1 or 3%.
This is a great example of the benefits of trading options. Let’s discuss this as a study case.
Option trading offers the potential of a lower initial investment and higher percentage gain. Let’s take a look and make a comparison.
The plus DI (green line) is above the -DI and if it stays above the -DI (red) line and rises above $27 by Friday a call trade can be considered.
If you buy 20 shares at $27, you will invest $540. If the stock increases in price to $28, you will earn a profit of $1 per share or $20 for the 20 shares or about 3%.
If you bought one option contract covering 100 shares of TECK with a Oct 15th (Oct 21) expiration date for the $28 strike and premium would be approximately $.98 today or $98 per 100 share contract. If price increased to the expected $28 target or a gain of $1 over the next few weeks, the premium would likely increase $1 to $1.98 ($1 x 100 share contract = $100 Profit.) $100 profit on your $98 investment, this is an 100% gain. Nice! Terrific trade if it hits it target!
Trading options is a win, win, win opportunity. Options often offer a smaller overall investment, covering more shares of stock and potential for greater profits.
I like to stress when trading options, you don’t need to wait for the expiration date to close the trade. You can close anywhere along the way prior to the expiration date. It is never a bad idea to take profit.
Trading options is like renting stocks for a fixed period of time. The potential to generate steady income with options is real and it can be transforming. Watch this video to learn how you can use option trading to achieve financial freedom. click here
Yours for a Prosperous Future,
Wendy Kirkland

Past Equity Candidates:
Two weeks ago, we discussed AMZN 3600 strike with a Sept 24th expiration and premium of $33.95. It moved up to $3549.99 and soon after started to head down with the market swings and slight pullback. The premium on Friday Sept 3rd was lower than when I listed it on Weds. Perhaps, around $27 and the next week it went as high as $37 or a $10 gain or $1,000.
Click here to check out the article here.


Recent Comments