
A week ago we expected the S&P to move back to its 50 day moving average and it politely delivered. But what it has done over the last few days is slightly different than what we have seen over and over since the beginning of the year.
More than a half dozen times it has pulled back to the 50 and then used that as support to move up about 150-200 points. I feel like a broken record as we keep pointing this out, but it is hard to complain about a unbelievably reliable pattern that you can use to make some lucrative trades.
And in almost every article we have written about this pattern we have noted that it is extremely consistent… until it isn’t.
That doesn’t mean this time will be the time it breaks out of the pattern, just that we have to be ready for the drop below the 50 day and make sure we aren’t over exposed.

In the past, the S&P has touched the 50 with for just a day, maybe two. This drop to its familiar support looks a little different. Check out the chart:
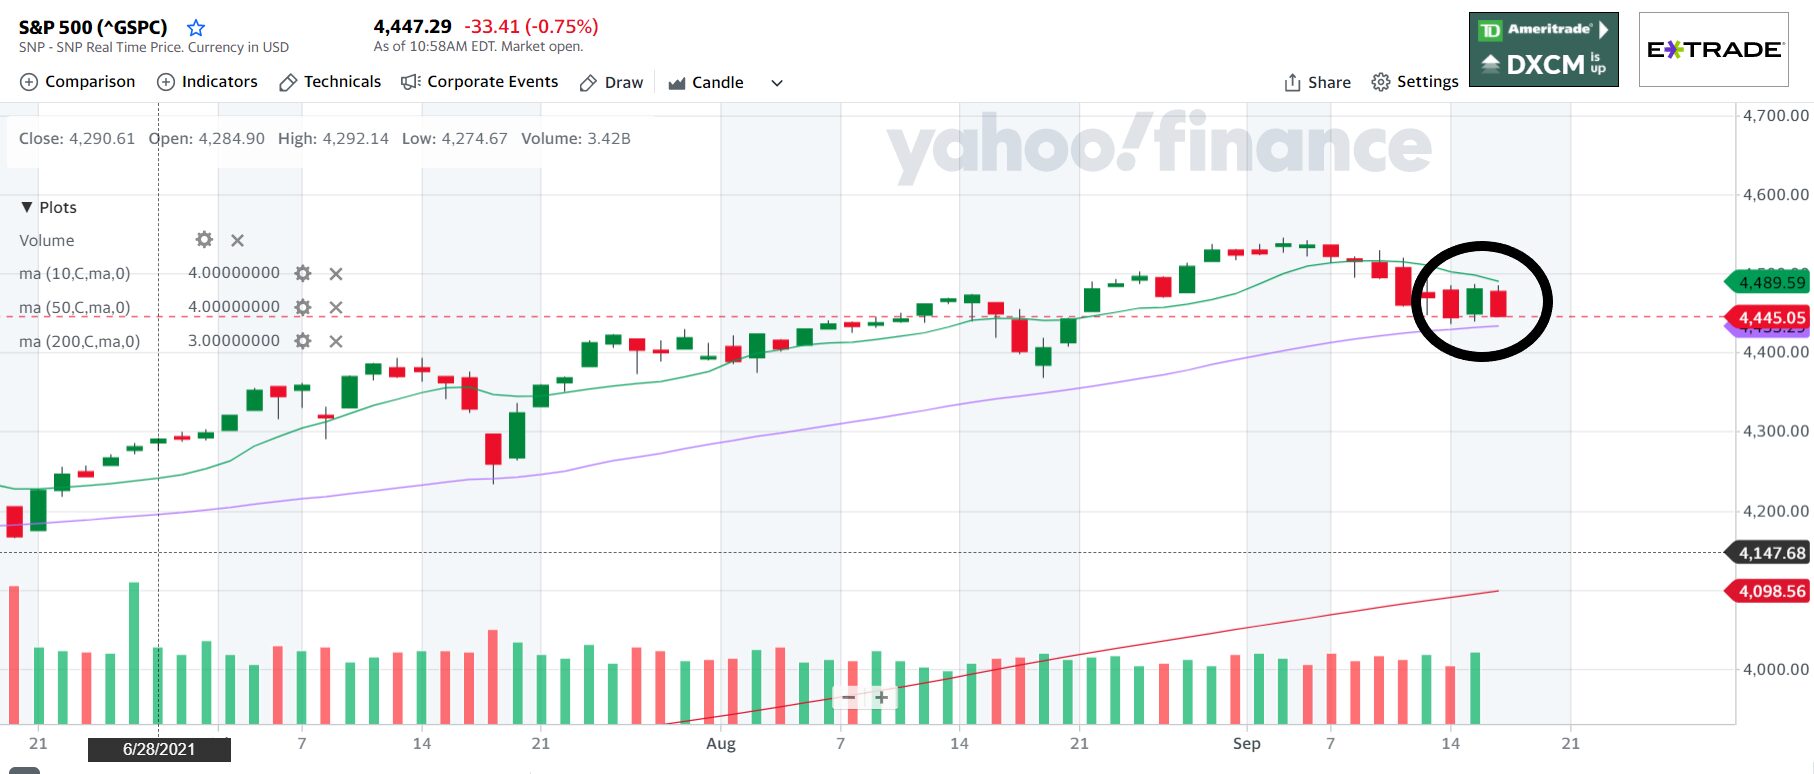
The S&P has been in a range this week resting on the 50 day for the almost the whole week. That is a sign of uncertainty and more that we have seen out of this cycle in the past. We are going to be watching to see if it breaks the 50 and then starts a deeper dive or if it is going to use this rest to move up with more energy.
Don Fishback has developed some of the most reliable tools for selecting the right option strategy for each market condition. In fact, his process calculates the probability of each strategy’s success in the current market. It is simply uncanny. Be sure and grab his free book here and check it out for yourself.
Keep learning and trade wisely,
John Boyer
Editor
Market Wealth Daily
PS- Be sure to check out the new chart on our Chart of the Week page. You can view it here.


Recent Comments