
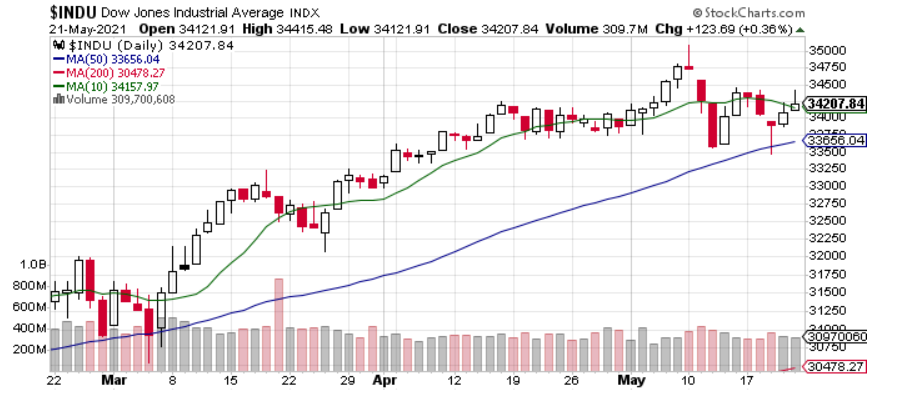
The Dow has, over the last three months, found a solid support from the 50 day and been able to recover after a correction and get closer to the 10 day.
The NASDAQ, however, has been much less graceful.
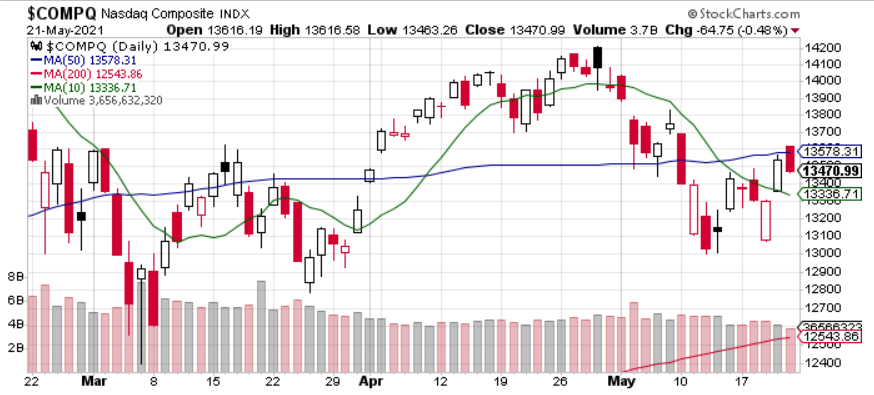
Tech has been much wilder and has fell through the 50 more often and feels way more fragile.
The key is that the current focus on inflation is having a much more dramatic impact on the NASDAQ. This is where momentum tools can really help key in on these swings and confirm the patterns.
Lee Gettess helps his readers identify the momentum patterns and turn these wild swings into winning trades.
Momentum Trading with Precision shows some of the most powerful examples of these indicators. Grab it here and make sure you are able to confirm the trend.
Keep learning and trade wisely,
John Boyer
Editor
Market Wealth Daily


Recent Comments