
Dear Reader,
While I was looking through my ‘buy list’ this morning to see if any ETFs were offering an attractive trade setup, I came across this one trade and I didn’t need to see any others.
You may have seen this trade setup earlier today too, but if not, don’t worry, I am going to tell you exactly which ETF is currently trading in the ‘Buy Zone’.
The ETF that caught my eye was the Consumer Discretionary Select Sector ETF, symbol: (XLY).
Once I saw the stock chart for the XLY ETF, I noticed that the ETF had traded into prime trade entry territory, which I call my ‘Buy Zone’.
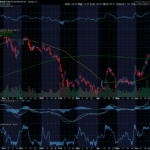
Below is a snapshot of XLY’s current stock chart. Let’s do some analysis of the chart so you can see what made me stop what I was doing and begin looking for a potential trade to place.

Looking at this chart for XLY, you can see the ETF is in the midst of a strong bullish uptrend which we want to target. But this alone is not enough to convince me that I need to jump in on a trade right then.
Another crucial component of placing successful trades over time is knowing the correct time to enter the trade. This is why I always look at the Keltner Channels before I fire off a trade.
Keltner Channels can serve as an overbought or oversold indicator for ETFs. If an ETF’s daily share price is trading above the upper Keltner Channel, this signals that the ETF is temporarily overbought and subject to a retracement.
Even ETFs that are in the strongest bull trends do not advance in a straight line. There are always price retracements along the way. When an ETF becomes overbought, more likely than not, the ETF will soon experience a slight pullback.
When we identify ETFs in powerful uptrends, these are the ETF’s we want to trade and we use the Keltner Channels to help pick our entry point. When a bullish ETF dips into our ‘Buy Zone’, this is when we want to put on a trade.
The Keltner Channel “Buy Zone” occurs when an ETF is trading below the upper Keltner Channel. Once the daily price is trading below the upper channel, it provides a lower-risk buying opportunity as the bullish ETF is likely to continue rallying.
 Unlock the door to profit opportunities! Join my Weekly Stock and Option Alert Newsletter for exclusive trade insights. Delve into multiple trade setups every week and receive actionable trade recommendations. Click here to sign up now!
How I Would Look to Trade It
Now that we have identified the ETF that we want to trade and we have pinpointed our entry point, the next question is how do we actually want to gain exposure to this trade?
I want to look to trade XLY’s trend and have the opportunity to capture some profits by placing an options trade on the ETF.
Below is a Call Option Debit spread for XLY that I found just this morning that would allow me to gain some exposure to the ETF’s powerful bullish trend but also have some downside protection built in as well. Let me tell you how this works.
Once I place a Call Option Debit spread, it has the ability to profit if the underlying stock/ETF is either up, flat, or even down a bit at option expiration.
Below is a snapshot of my Call Option Debit Spread Calculator that shows the profit potential and downside protection analysis for my trade. This example examines a range of a 7.5% increase to a 7.5% decrease in XLY share price at option expiration.

Looking at the trade analysis, the calculator shows that this one single trade, that would cost you only $332 to enter, has the ability to profit 50.6%.
The calculator reveals that if XLY, at option expiration, were to increase, remain flat, or even drop by as much as 7.5%, this low-cost trade would be set up to make a 50.6% return!
This Call Option Debit Spread strategy has been one of my absolute favorites to trade over the years and remains so today. The key behind it all is that by enabling your ability to profit if an ETF is up, flat, or even down a bit gives you a much higher probability that your trade will end up a winner.
The Hughes Optioneering Team is here to help you identify high-probability trades just like this one.
Interested in accessing the Optioneering Calculators? Join one of Chuck’s Trading Services for unlimited access! The Optioneering Team has option calculators for six different option strategies that allow you to calculate the profit potential for an option trade before you take the trade.
Chuck’s $3,000 Trading Scholarship
I don’t want you to miss a single opportunity to potentially reach your goals. That’s why I’d like to offer you a scholarship of the full $3,000 Enrollment Fee of my exclusive Lightning Trade Alerts Service.
I want you to follow in my footsteps and have the opportunity to succeed beyond your wildest dreams!
Please give my team a call at 1-866-661-5664 OR Click the button below to schedule a call and get started today!

Wishing You the Best in Investing Success,

Chuck Hughes
Editor, Trade of the Day
Have any questions? Email us at dailytrade@chuckstod.com
*Trading incurs risk and some people lose money trading.


Recent Comments