
Dear Reader,
Yesterday, we looked at a Daily Price Chart for Tractor Supply Co. noting that the stock has been making a series of higher highs and higher lows.
For today’s Trade of the Day e-letter we will be looking at a daily price chart for O’Reilly Automotive, Inc. stock symbol: ORLY.
Before breaking down ORLY’s daily chart let’s first review what products and services the company offers.
O’Reilly Automotive, Inc., together with its subsidiaries, operates as a retailer and supplier of automotive aftermarket parts, tools, supplies, equipment, and accessories in the United States and Mexico. The company provides new and remanufactured automotive hard parts and maintenance items, such as alternators, batteries, brake system components, belts, chassis parts, driveline parts, engine parts, fuel pumps, hoses, starters, temperature control, water pumps, antifreeze, appearance products, engine additives, filters, fluids, lighting products, and more.
Now, let’s begin to break down the Daily Price chart for ORLY stock.
Below is a Daily Price chart with the 50-Day EMA and 100-Day EMA for ORLY.

50-Day EMA and 100-Day EMA ‘Buy’ Signal
The 50-Day Exponential Moving Average (EMA) and 100-Day EMA are moving average indicator lines that can provide buy and sell signals when used together. When the shorter-term 50-Day EMA crosses above or below the longer-term 100-Day EMA, this provides either a buy or sell signal depending on which direction the stock price is moving.
- 50-Day EMA line Above 100-Day EMA = Price Uptrend = Buy signal
- 50 Day EMA line Below 100-Day EMA = Price Downtrend = Sell signal
When the 50-Day EMA (blue line) crosses above the 100-Day EMA (red line) this indicates that the stock’s buying pressure has begun to outweigh the selling pressure signaling a ‘buy’ signal. When the 50-Day EMA crosses below the 100-Day EMA this indicates that the selling pressure has begun to outweigh the buying pressure signaling a ‘sell’ signal.
Buy ORLY Stock
As the chart shows, on July 22nd, 2022, the ORLY 50-Day EMA, crossed above the 100-Day EMA.
This crossover indicated the buying pressure for ORLY stock exceeded the selling pressure. For this kind of crossover to occur, a stock has to be in a strong bullish trend.
Now, as you can see, the 50-Day EMA is still above the 100-Day EMA meaning the ‘buy’ signal is still in play.
As long as the 50-Day EMA remains above the 100-Day EMA, the stock is more likely to keep trading at new highs and should be purchased.
Our initial price target for ORLY stock is 925.00 per share.
Profit if ORLY is Up, Down or Flat
Now, since ORLY’s 50-Day EMA is trading above the 100-Day EMA and will likely rally from here, let’s use the Hughes Optioneering calculator to look at the potential returns for an ORLY call option spread.
The Call Option Spread Calculator will calculate the profit/loss potential for a call option spread based on the price change of the underlying stock/ETF at option expiration in this example from a 7.5% increase to a 7.5% decrease in ORLY stock at option expiration.
The goal of this example is to demonstrate the ‘built in’ profit potential for option spreads and the ability of spreads to profit if the underlying stock is up, down or flat at option expiration. Out of fairness to our paid option service subscribers we don’t list the option strike prices used in the profit/loss calculation.
The prices and returns represented below were calculated based on the current stock and option pricing for ORLY on 4/20/2023 before commissions.
Built in Profit Potential
For this option spread, the calculator analysis below reveals the cost of the spread is $1310 (circled). The maximum risk for an option spread is the cost of the spread.
The analysis reveals that if ORLY stock is flat or up at all at expiration the spread will realize a 52.7% return (circled).
And if ORLY stock decreases 7.5% at option expiration, the option spread would make a 33.3% return (circled).
Due to option pricing characteristics, this option spread has a ‘built in’ 52.7% profit potential when the trade was identified*.
Option spread trades can result in a higher percentage of winning trades compared to a directional option trade if you can profit when the underlying stock/ETF is up, down or flat.
A higher percentage of winning trades can give you the discipline needed to become a successful trader.
The Hughes Optioneering Team is here to help you identify profit opportunities just like this one.

Interested in accessing the Optioneering Calculators? Join one of Chuck’s Trading Services for unlimited access! The Optioneering Team has option calculators for six different option strategies that allow you to calculate the profit potential for an option trade before you take the trade.
Trade High Priced Stocks for $350 With Less Risk
One of the big advantages to trading option spreads is that spreads allow you to trade high price stocks like Amazon, Google, or Netflix for as little as $350. With an option spread you can control 100 shares of Netflix for $350. If you were to purchase 100 shares of Netflix at current prices it would cost about $32,000. With the stock purchase you are risking $32,000 but with a Netflix option spread that costs $350 your maximum risk is $350 so your dollar risk is lower with option spreads compared to stock purchases.
Average Portfolio Return of 185.1%
Below is a screenshot of the current open trade profit opportunities from Chuck’s Inner Circle Trading Service. There are currently $174,445.25 in open trade profit opportunities with an average portfolio return of 185.1% demonstrating the ability of the Optioneering Strategy to deliver substantial returns with no losing portfolios**.
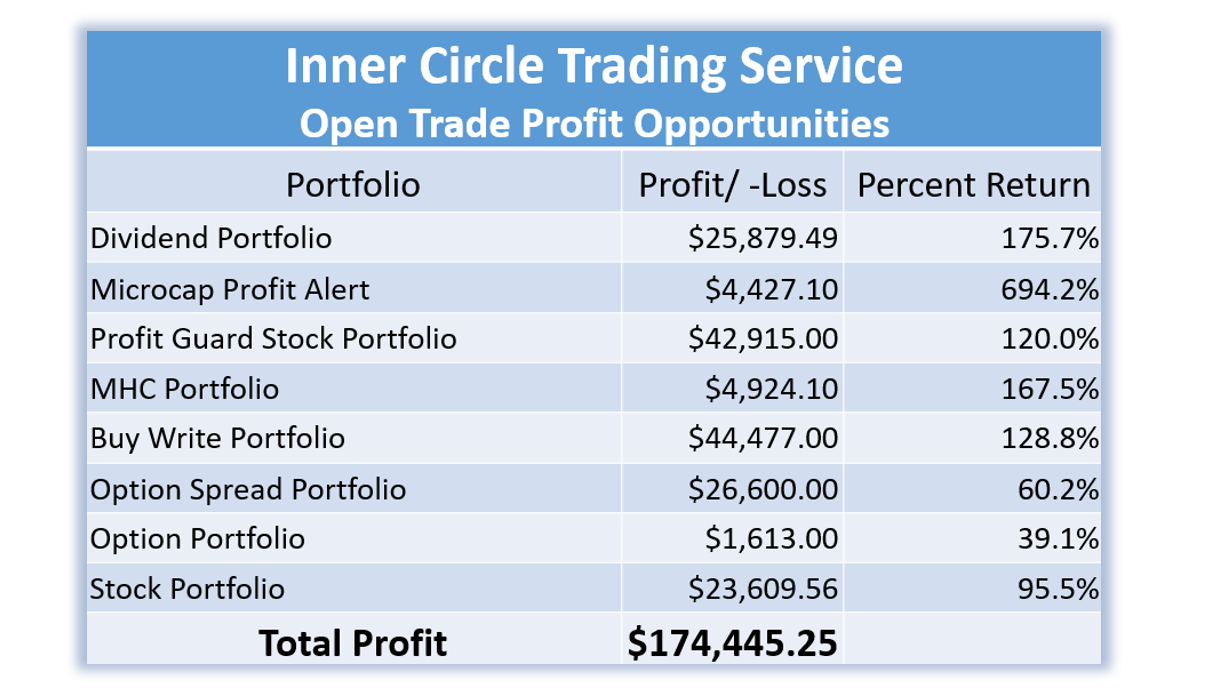
**Open trade profit results represent the open trade profit performance for the portfolio displayed on 4/20/23. Open trade profits may have increased or decreased when trades were closed out. Trading incurs risk and some people lose money trading. Past performance does not necessarily predict future results. Member profits and losses are not tracked. Profit potential is taken from results of signaled trades, not actual member results. Not all members make the trades.
Get Trade Insights Directly From Chuck
You can start getting market insights directly from 10-Time Trading Champion Chuck Hughes.
See what he’s trading and when with his exclusive Inner Circle Trading Service where he will send you his hand-picked stock and option trades.
Just call Brad at 1-866-661-5664 or 1-310-647-5664 to join or CLICK HEREto schedule a call!
Wishing You the Best in Investing Success,

Chuck Hughes
Editor, Trade of the Day
Have any questions? Email us at dailytrade@chuckstod.com
*Trading incurs risk and some people lose money trading.


Recent Comments