Dear Reader,
Yesterday, we looked at a 10-month SMA chart for TAP, noting that the stock was in a bullish 10-month SMA uptrend.
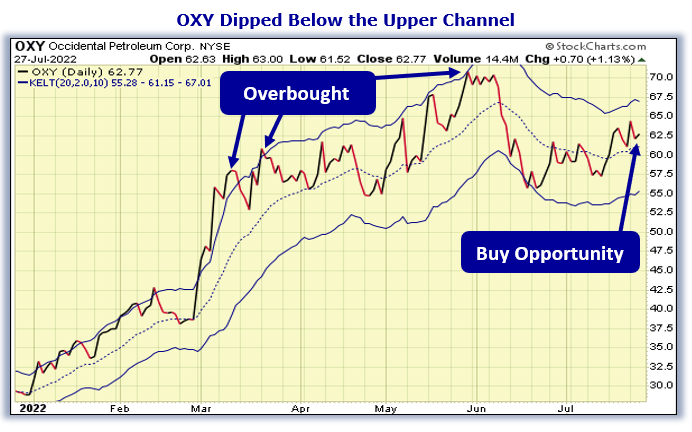
For today’s Trade of the Day we will be looking at a Keltner Channel chart for Occidental Petroleum, stock symbol: OXY.
Before breaking down OXY’s daily Keltner Channel chart let’s first review which products and services are offered by the company.
Occidental Petroleum engages in the acquisition, exploration, and development of oil and gas properties in the United States, the Middle East, Africa, and Latin America. It operates through three segments: Oil and Gas, Chemical, and Midstream and Marketing.
Now, let’s begin to break down the Keltner Channel chart for OXY. Below is a Daily Price Chart and the three Keltner Channels for OXY stock.
Buy OXY Stock
The Hughes Optioneering Team uses the Keltner Channels as an indicator to determine whether a stock is overbought or oversold. If a stock’s daily stock price is trading above the upper Keltner Channel, this signals that the stock is temporarily overbought and subject to a retracement.
Even stocks that are in the strongest bull trends do not advance in a straight line. There are always price retracements along the way. When a stock becomes overbought, it’s price will typically decline soon after as the inevitable profit taking occurs.
The OXY daily price chart shows that the stock is in a strong price uptrend and has become overbought several times. The stock produced a High Probability ‘Buy’ signal after dropping below the lower Keltner Channel back in June and has increased in price since then.
Finding opportunities when a stock experiences a pullback is why the Hughes Optioneering Team uses the Keltner Channels. They help us find a lower-risk entry point.
The Keltner Channel “Buy Zone” occurs when a stock is trading below the upper Keltner Channel. Once the daily price is trading below the upper channel, it provides a lower-risk buying opportunity as the stock is likely to rally.
Our initial price target for OXY stock is 70.63 per share.

61.3% Profit Potential for OXY Option
Now, since OXY stock is in a strong uptrend and currently trading below the upper Keltner Channel, we should consider purchasing a call option. Let’s use the Hughes Optioneering calculator to look at the potential returns for an OXY call option purchase.
The Call Option Calculator will calculate the profit/loss potential for a call option trade based on the price change of the underlying stock/ETF at option expiration in this example from a flat OXY price to a 12.5% increase.
The Optioneering Team uses the 1% Rule to select an option strike price with a higher percentage of winning trades. In the following OXY option example, we used the 1% Rule to select the OXY option strike price but out of fairness to our paid option service subscribers we don’t list the strike price used in the profit/loss calculation.
Trade with Higher Accuracy
When you use the 1% Rule to select an OXY in-the-money option strike price, OXY stock only has to increase 1% for the option to breakeven and start profiting! Remember, if you purchase an at-the-money or out-of-the-money call option and the underlying stock closes flat at option expiration it will result in a 100% loss for your option trade! In this example, if OXY stock is flat at 62.78 at option expiration, it will only result in a 3.2% loss for the OXY option compared to a 100% loss for an at-the-money or out-of-the-money call option.
Using the 1% Rule to select an option strike price can result in a higher percentage of winning trades compared to at-the-money or out-of-the-money call options. This higher accuracy can give you the discipline needed to become a successful option trader and can help avoid 100% losses when trading options.
The goal of this example is to demonstrate the powerful profit potential available from trading options compared to stocks.
The prices and returns represented below were calculated based on the current stock and option pricing for OXY on 7/27/2022 before commissions.
When you purchase a call option, there is no limit on the profit potential of the call if the underlying stock continues to move up in price.
For this specific call option, the calculator analysis below reveals if OXY stock increases 5.0% at option expiration to 65.92 (circled), the call option would make 22.6% before commission.
If OXY stock increases 10.0% at option expiration to 69.06 (circled), the call option would make 48.4% before commission and outperform the stock return nearly 5 to 1.
And if OXY stock increases to our initial price target of 70.63 at option expiration the call option would make 61.3% before commission*.
The leverage provided by call options allows you to maximize potential returns on bullish stocks.
The Hughes Optioneering Team is here to help you identify winning trades just like this one.

Interested in accessing the Optioneering Calculators? Join one of Chuck’s Trading Services for unlimited access! The Optioneering Team has option calculators for six different option strategies that allow you to calculate the profit potential for an option trade before you take the trade.
Chuck’s $3,000 Trading Scholarship
I don’t want you to miss a single opportunity to potentially reach your goals. That’s why I’d like to offer you a scholarship of the full $3,000 Enrollment Fee of my exclusive Inner Circle Trading Service.
I want you to follow in my footsteps and succeed beyond your wildest dreams, so please call Brad in my office at 1-866-661-5664 or 1-310-647-5664 and get started today!
You can also CLICK HERE to schedule a call now!
Wishing You the Best in Investing Success,

Chuck Hughes
Editor, Trade of the Day
Have any questions? Email us at dailytrade@chuckstod.com
*Trading incurs risk and some people lose money trading.


Recent Comments