
by Russell Sands
One of the most important principles we have in Turtle Trading is that of the Last Theoretical Trade, also known as the P/L Filter. This powerful concept helps to avoid trades that do not have a lot of expectation going for them. In the world of the computer, our systems make almost a hundred percent per year, but they also take every trade that qualifies under the breakout rules. This may be fine for some people, but it is economically inefficient. Some of us may not have sufficient margin in our accounts to take every breakout, and even if this is not a problem, it may be difficult keeping track of too many simultaneous trades.
But more importantly, taking every breakout is an inferior method of trading. If you could eliminate some of the trades, and not reduce your total profits, you would have a better system. What is better, to make $100K per year with one hundred trades, or two make the same $100K per year with only seventy trades? Aside from the obvious savings of commissions and execution costs, the second system is more efficient in that it makes more money on a per trade basis (higher ‘per trade expectation’).
The P/L Filter is designed to eliminate approximately thirty percent of the total number of signals generated each year, without any corresponding reduction in profits. This is possible because the filter will eliminate trades that either have a lower probability of working, or else have a lower payoff on the trades that do work. Home run type trades are rare enough to begin with, and it is extremely unlikely that a trade which is not P/L selected will generate a huge profit. But, even during the times that you do miss a large move, honoring the P/L filter consistently will keep you out of enough bad trades to more than compensate for this possible type II error.

Simply put, the rule is that trades after profits are less likely to work, because the market will rarely go straight up and then straight down in simultaneous smooth trends. Much more likely is the scenario of alternating periods of trend and consolidation, implying that after a nice trend you should expect a period of consolidation, as opposed to expecting another nice trend. Since all of your profits come from capturing trendy moves, we can restate the rule above to say that signals after profitable tends are less likely to produce a second profitable trend, and more likely to be a false breakout signaling a period of consolidation, which is what we want to avoid.
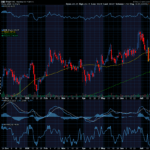
In attempting to employ this rule in our chart interpretation, we simply will look at alternating four week breakouts. For our purposes, all four week breakouts will always alternate in direction, and each new four week breakout will signal the end of the trade generated by the prior breakout. Also, we will only focus on trades that would be made at these breakout points, as opposed to trades actually made in your account, hence the name ‘last theoretical trade.’ If this sounds confusing, just look at the chart below for the Swiss. The market had been in a nice uptrend since May, when it made a four week breakout to the upside above 6800 (pt A). This trade continued until the middle of September, when the market went four weeks lower under 7500 (pt B). Regardless of where anyone bought into this trade, or where they got out, it is less breakout points which are relevant to our analysis.

If considering going short at B, you now must ask yourself, was the last (theoretical) trade a profit or a loss? If it was a loss, then you are okay to take the current trade, but if it was a profit, then the current trade under consideration (the short at B) is less likely to be another trendy move, and you may want to avoid the trade. Clearly, the last trade in this case, going long at A and liquidating that trade at B, was a large profit, so that going short at B becomes considerably less attractive. We should expect this downside breakout to fail even more often than the 65-70% of the time the most breakouts fail. However, even if the downward trend validated itself, statistics have shown that this trade would have a much lower than normal chance of turning into the large profitable trend that we try to capture.
Considering going long at pt C, however, is another story. Even though this trade obviously did not work, it was favorably P/L selected. In this case, the last theoretical trade would have been a short at B, which would be liquidated at C (an obvious loss). Remember, even though we said above that we would not have taken this trade in real life, the last theoretical trade for purposes of this filter means looking at the previous four week breakout (in the opposite direction) on the chart, regardless of whether you actually made the trade in your own account. Finally, going short at pt D is also favorably P/L selected since the last trade, in this case, both practical as well as theoretical, was the long trade at C, which also obviously failed.
In terms of alternating scenarios, after the nice profitable trend from pt A to pt B, we should expect this market to go into a period of consolidation, as opposed to another directional move. One way of defining a consolidation is that it is a period of false breakouts, when alternating four week breakouts will fail. Unfortunately, we do not know when we are in consolidation until after we have learned it the hard way. But, by understanding the market characteristics of alternating trends and consolidations, and employing the P/L filter appropriately, we may be able to avoid many breakouts, which seem predestined to fail. Even if we can’t improve the win/loss ratio of our trading, we will improve our overall results by weeding out trades with low expectation, which would otherwise lower both our average results as well as our total results.


Recent Comments