
Dear Reader,
Yesterday we looked at a Daily Price Chart for Workday, noting that the stock was in a 50/100-Day EMA downtrend.
For today’s Trade of the Day e-letter we will be looking at a daily price chart for CRISPR Therapeutics AG, stock symbol: CRSP.
Before breaking down CRSP’s daily chart let’s first review what products and services the company offers.
CRISPR Therapeutics AG, a gene editing company, focuses on developing gene-based medicines for serious diseases using its proprietary CRISPR platform. The company has a portfolio of therapeutic programs across a range of disease areas, including hemoglobinopathies, oncology, regenerative medicine, and rare diseases.
Now, let’s begin to break down the Daily Price chart for CRSP stock.
Below is a Daily Price chart with the 50-Day EMA and 100-Day EMA for CRSP.
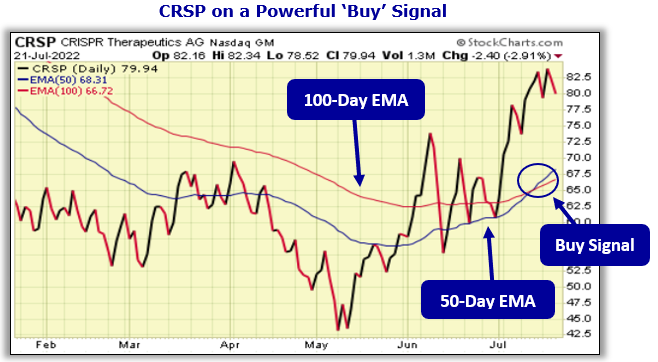
50-Day EMA and 100-Day EMA ‘Buy’ Signal
The 50-Day Exponential Moving Average (EMA) and 100-Day EMA are moving average indicator lines that can provide buy and sell signals when used together. When the shorter-term 50-Day EMA crosses above or below the longer-term 100-Day EMA, this provides either a buy or sell signal depending on which direction the stock price is moving.
- 50-Day EMA line Above 100-Day EMA = Price Uptrend = Buy signal
- 50 Day EMA line Below 100-Day EMA = Price Downtrend = Sell signal
When the 50-Day EMA (blue line) crosses above the 100-Day EMA (red line) this indicates that the stock’s buying pressure has begun to outweigh the selling pressure signaling a ‘buy’ signal. When the 50-Day EMA crosses below the 100-Day EMA this indicates that the selling pressure has begun to outweigh the buying pressure signaling a ‘sell’ signal.

Buy CRSP Stock
As the chart shows, on July 14th, the CRSP 50-Day EMA, crossed above the 100-Day EMA.
This crossover indicated the buying pressure for CRSP stock exceeded the selling pressure. For this kind of crossover to occur, a stock must be in a strong bullish trend.
Now, as you can see, the 50-Day EMA is still above the 100-Day EMA meaning the ‘buy’ signal is still in play.
As long as the 50-Day EMA remains above the 100-Day EMA, the stock is more likely to keep trading at new highs and should be purchased.
Our initial price target for CRSP stock is $87.00 per share.
Profit if CRSP is Up, Down or Flat
Now, since CRSP’s 50-Day EMA is trading above the 100-Day EMA and will likely rally from here, let’s use the Hughes Optioneering calculator to look at the potential returns for a CRSP call option spread.
The Call Option Spread Calculator will calculate the profit/loss potential for a call option spread based on the price change of the underlying stock/ETF at option expiration in this example from a 10.0% increase to a 10.0% decrease in CRSP stock at option expiration.
The goal of this example is to demonstrate the ‘built in’ profit potential for option spreads and the ability of spreads to profit if the underlying stock is up, down, or flat at option expiration. Out of fairness to our paid option service subscribers we don’t list the option strike prices used in the profit/loss calculation.
The prices and returns represented below were calculated based on the current stock and option pricing for CRSP on 7/21/2022 before commissions.
Built in Profit Potential
For this option spread, the calculator analysis below reveals the cost of the spread is $1,070 (circled). The maximum risk for an option spread is the cost of the spread.
The analysis reveals that if CRSP stock decreases -5%, stays flat, or goes up at all at expiration the spread will realize a 40.2% return (circled).
And if CRSP stock decreases 10.0% at option expiration, the option spread would make a 11.7% return (circled).
Due to option pricing characteristics, this option spread has a ‘built in’ 40.2% profit potential when the trade was initiated*.
Option spread trades can result in a higher percentage of winning trades compared to a directional option trade if you can profit when the underlying stock/ETF is up, down, or flat.
A higher percentage of winning trades can give you the discipline needed to become a successful trader.
The Hughes Optioneering Team is here to help you identify winning trades just like this one.

Interested in accessing the Optioneering Calculators? Join one of Chuck’s Trading Services for unlimited access! The Optioneering Team has option calculators for six different option strategies that allow you to calculate the profit potential for an option trade before you take the trade.
Trade High Priced Stocks for $350 With Less Risk
One of the big advantages to trading option spreads is that spreads allow you to trade high price stocks like Amazon, Google, Microsoft or Apple for as little as $350. With an option spread you can control 100 shares of Microsoft for $350. If you were to purchase 100 shares of Microsoft at current prices it would cost about $26,000. With the stock purchase you are risking $26,000 but with a Microsoft option spread that costs $350 your maximum risk is $350 so your dollar risk is lower with option spreads compared to stock purchases.
Chuck’s $3,000 Trading Scholarship
I don’t want you to miss a single opportunity to potentially reach your goals. That’s why I’d like to offer you a scholarship of the full $3,000 Enrollment Fee of my exclusive Inner Circle Trading Service.
I want you to follow in my footsteps and succeed beyond your wildest dreams, so please call Brad at 1-866-661-5664 or 1-310-647-5664 and get started today!
You can also CLICK HERE to schedule a call now!
Wishing You the Best in Investing Success,
Chuck Hughes
Editor, Trade of the Day
Have any questions? Email us at dailytrade@chuckstod.com

*Trading incurs risk and some people lose money trading.


Recent Comments