
Happy Marvelous Monday!
I help teach people to earn money trading options. It isn’t hard. I explain in easy-to-understand terms when I teach or write a book—like we are talking across the kitchen table.
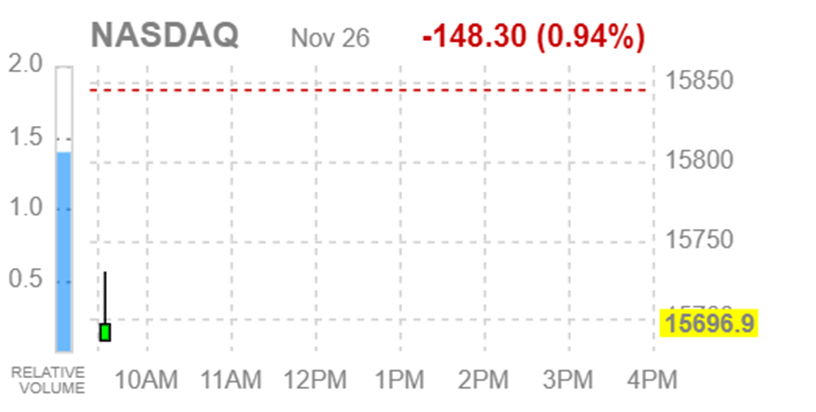
The Nasdaq was down 4 days out of 5 as the bottom fell out the day after the Thanksgiving holiday. A new virus variant has shaken up travel related companies and the outlook for upcoming holiday.
For updates on previous trades, please scroll down.
I am going to focus on the NASDAQ on Mondays and call it “QQQ Monday”. I will focus on QQQ which is the ETF covering companies traded within the NASDAQ Exchange Traded Fund.
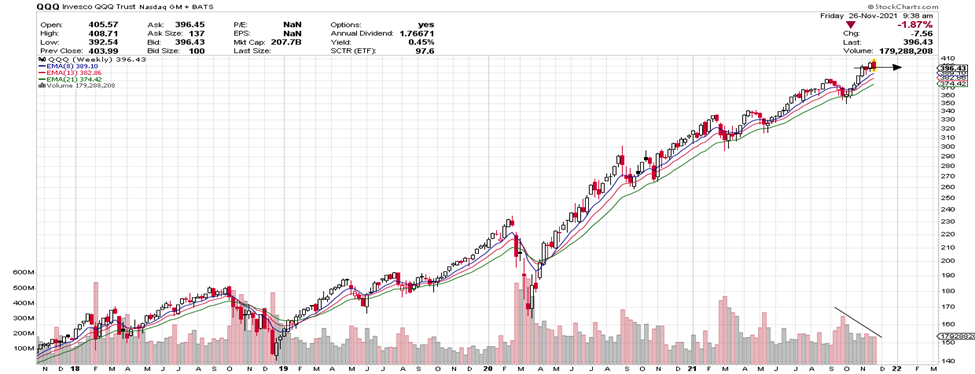
For today’s discussion, we will be looking at Invesco QQQ Trust, symbol (QQQ).
Before analyzing QQQ’s charts, let’s take a closer look at the ETF and its services.
Invesco QQQ is an exchange-traded fund that tracks the Nasdaq-100 Index™. The Index includes the 100 largest non-financial companies listed on the Nasdaq based on market cap. These companies are often cut-edge tech stocks and trendier companies.
The image below is Friday’s price activity – at open.
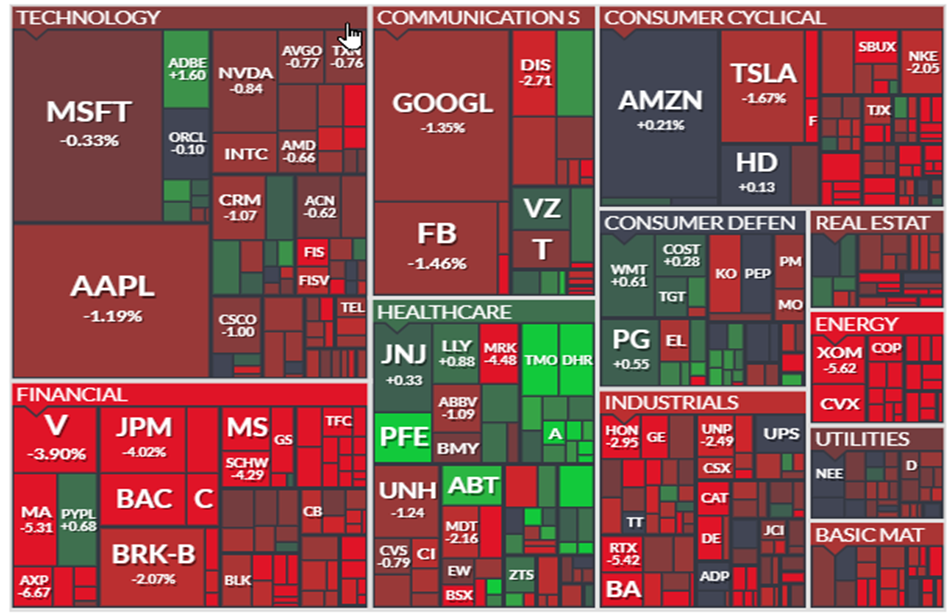
This chart image is courtesy of FINVIZ.com a free website and gives a quick view of each day’s movement.

This is an image from Friday where it dropped throughout most of the day. The carpet shows a lot of red. Many of the symbols with 4 or 5 letters are included in the QQQs- AAPL, AMZN, GOOGL, etc.
Fibonacci Exponential Moving Averages (EMA)
Exponential moving averages (EMAs) reduce the lag seen in simple moving averages by applying more weight to recent prices. The weighting applied to the most recent price depends on the number of periods in the moving average. We are applying 8, 21, and 55 weekly periods for our entry signals. EMAs differ from simple moving averages in that a given day’s EMA calculation depends on the EMA calculations for all the days prior to that day. You need far more than 10 days of data to calculate a reasonably accurate 10-day EMA.
There are three steps to calculating an exponential moving average (EMA). First, calculate the simple moving average for the initial EMA value. An exponential moving average (EMA) must start somewhere, so a simple moving average is used as the previous period’s EMA in the first calculation. Second, calculate the weighting multiplier. Third, calculate the exponential moving average for each day between the initial EMA value and today, using the price, the multiplier, and the previous period’s EMA value.
Charting services like Stockcharts.com and your broker’s chart service figure these calculations for you.
As mentioned, entry signals are based on the use of 8, 21, and 55 weekly averages. (8, 21 and 55 are Fibonacci numbers which are a special sequence of numbers which are added together- 1+1= 2, 2+1=3, 2+3=5, 5+3= 8, etc. 13, 21, 34, 55, 89, 144, 233, 377, 600… As mentioned, we are zeroing in on 8 EMA (short term), 21 EMA (medium term) and 55 EMA (long term).
Let’s See Why This Signal Potentially Offers Potential Trade Info
Each candle on the chart represents price movement over a 5-day (week) period. QQQ is apt to continue to drop or flatten out if the EMAs curl and down and going lower. In March and May this year, price pulled back toward the 21 EMA and then, bounced up off that area. The last 4 weeks price have been heading up, as seen above, but have switched between red and black every other week with the end result being flat. It seems tired and ready for a pullback.
As long as the 8 EMA remains above the 21 EMA and the 8 and 21 EMA both remain above the 55 EMA, said to be in uptrending order, its current uptrend will remain intact, and price will continue to rise or go flat. If this week heads down, we will likely have a flat or indecisive final quarter of 2021. If it were to drop and have a weekly candle close below the 8 EMA, that would be a breech and then we would need to adjust our outlook. We will keep an eye on QQQ’s movement over the course of the couple weeks.
I feel we should take a break this week. Let’s not consider a trade since Friday’s drop is a major shift and as I type on Friday, I have no idea what will happen over the weekend or on Monday. Futures are way down as I type. The overall bias is down, and the last candle says it wants to continue heading down.
Potential Profit Play for QQQ
Last week, I expected a bullish week, and it ended up down- flat until Friday’s drop. Three days down. When daily moves were combined, it closed down for the week. If Monday continues to drop from its bearish close on Friday, a Put trade could be considered if price drops below the 8 EMA but there is no way of knowing the outcome as I type this on Friday.
The stock market closes at 1:00 PM ET today- open a half day. Enjoy the extended Thanksgiving holiday!
General info:
Options often offer a smaller overall investment, covering more shares of stock and potential for greater profits, as well as making money when the price of a stock drops.
Remember, you can take profit anywhere along the line, you don’t have to wait for the expiration date to sell. It is often wise to take profit when it is earned, especially in a volatile market.
If price drops below the support line, it can be wise to sell to reduce loss. As the expiration date nears, the premium will lose an increasing time value.
EMAs and line crosses are at the heart of most of my strategies. Many strategies come with a weekly newsletter listing numerous potential trade candidates.
I love teaching and sharing. It is my “thing”.
Yours for a prosperous future,
Wendy Kirkland
PS-I have created this daily letter to help you see the great potential you can realize by trading options. Being able to recognize these set ups are a key first step in generating wealth with options. Once you are in a trade, there is a huge range of tools that can be used to manage the many possibilities that can present themselves. If you are interested in learning how to apply these tools and increase the potential of each trade click here.
Past trade update:
Four weeks ago, we looked at November 29th (Nov wk 4) expiration and a 395 strike and a premium of 2.89. On Friday the premium closed at 10.00 That was a gain of 7.11 or 246% profit. Last week it dropped.
Three weeks ago, we discussed a November 29th (Nov wk 4) expiration and a 405 strike and premium of 3.62. Monday opened down so there was no new trade.
Two weeks ago, we talked about an Dec 3rd (Dec wk 1) expiration for a 400 strike and a premium of $3.84. This week the premium rose to 7.47 or a 95% gain in a week. Last week it dropped.
Last week, we discussed the Dec 6th (Dec wk 1) expiration on a 410 strike of the QQQs for 2.51. Monday, price dropped after a quick pop on open, it then dropped throughout the day. No trade.


Recent Comments