Tuesday, July 20, 2021
Happy Thankful Tuesday!
I am excited to share that you don’t need special education or to sit in front of the computer all day to trade options. It can be easily learned if you are interested in spending an hour or so a week earning money in what could be considered “renting” stocks for a short period of time.
This is why I show you the details about an equity’s symbol and pattern each week.
I am typing this on Sunday, before the new week starts. Last week, the Dow was up 3 days out of 5, while the S&P Nasdaq climbed to record highs. Finally, the Dow has got in step with the other indices and then Thursday and Friday all three indices pulled back. The Summer months are often a quiet market time with slight pullbacks and then it recovers into the end of the year. We have been heading up for months and a pullback is due.
For the updates on previously discussed symbols, please scroll down.
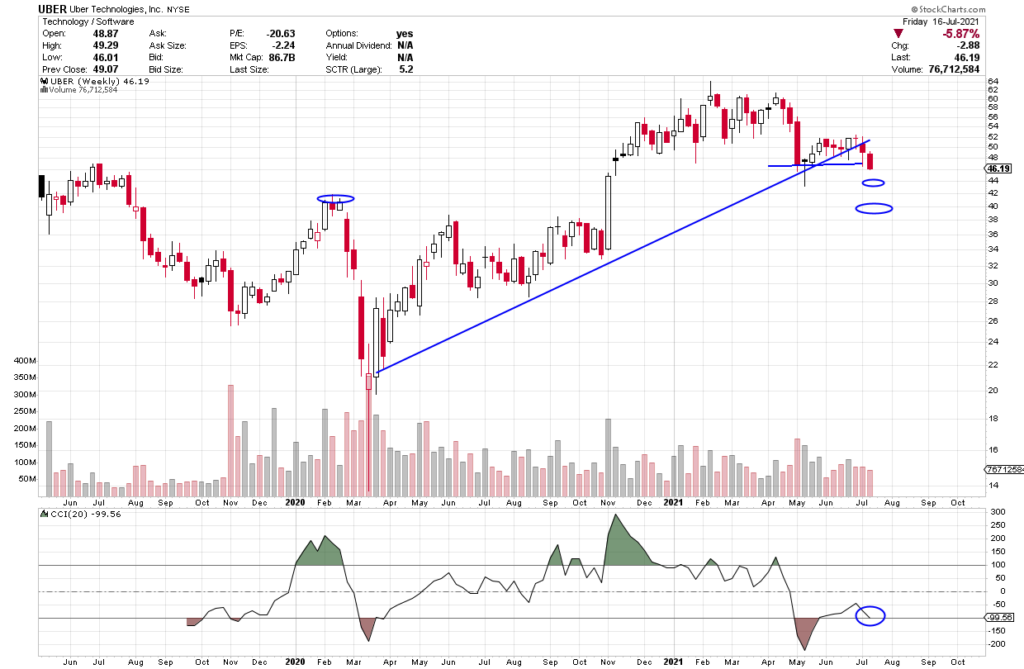
For today’s Trade of the Day, we will be looking at Uber Technology, Inc. symbol (UBER).
Before analyzing UBER’s chart, let’s take a closer look at the company and its services.
Uber Technologies, Inc. develops and operates proprietary technology applications in the United States, Canada, Latin America, Europe, the Middle East, Africa, and the Asia Pacific. It connects consumers with independent providers of ride services for ridesharing services and other forms of transportation services, including public transit, as well as connect riders and other consumers with restaurants, grocers, other stores, and delivery service providers for meal preparation, grocery, and other delivery services.
The company was formerly known as Ubercab, Inc. and changed its name to Uber Technologies, Inc. in February 2011. Uber Technologies, Inc. was founded in 2009 and is headquartered in San Francisco, California.
Each candle on the chart represents price movement over a 5-day (week) period. The indicator at the bottom of the chart is a Channel Commodity Index (CCI).
I drew a line below the candles, if price rises above that line, it would be time to close. Watch for a continued fall toward its target.

A cross above or a bounce off or cross through the CCI -100 line is bearish, in that it is suggesting price has gone from bearish to even more bearish. If you want to learn more about the CCI, you can read through the short section below or you can scroll down to the alert signal.
Channel Commodity Index
A cross up and over the CCI -100 or the zero line can issue an entry signal as it moves from being bearish to bullish. A rise toward 100 is a continuation of that bullishness. Up through the 100 line creates a green fin of bullishness, until it drops back down through the 100-line.
Also, a pullback and then, as it heads back up is another bullish indicator.
A break below the zero line means it has gone from bullish to bearish and a drop below -100 suggests even more bearishness.
The Commodity Channel Index (CCI) is a versatile indicator that can be used to identify a new trend or warn of extreme conditions. Originally, it was developed to identify cyclical turns in commodities, but the indicator can be successfully applied to indices, ETFs, stocks and other securities. In general, CCI measures the current price level relative to an average price level over a given period. CCI is relatively high when prices are far above their average but is relatively low when prices are far below their average. In this manner, CCI can be used to identify overbought and oversold levels or breaks from one level to another.
Check Out How This Rise in Price Could Pay Out Big Time
UBER is bearish as it drops further below the zero line. This week’s candle is apt to continue its downward movement that could take it lower. We are looking for a continued drop toward 44 and then lower.
If you find that you like the CCI Indicator as an easy-to-read indicator, it is included in the 5-Star Academy educational program which includes a chatroom where I am during the day to do live teaching sessions on M-W-F and to answer questions during the day. It is an incredibly supportive community.
Potential Profit Play for UBER
UBER’s price pulled back in April and it is starting a new downward move. I am writing this on Sunday, if price is dropping when you receive this on Tuesday, you could consider a put option trade. We are expecting the CCI indicator to drop below the -100 line and head down.
Price is currently at approximately $46 as I write over the weekend and is expected to continue heading down to, perhaps, $44 and then lower.
As long as the CCI line drops below the -100 line and then, continues down, price will continue its current downtrend and continue to drop. We will keep an eye on over the course of the next few weeks.
The short-term price target for UBER is $44 and, perhaps, lower.
To buy shares of Uber (UBER) stock today would cost approximately $46 per share.
I am suggesting that the price of UBER may drop to $44.
Option trading offers the potential of a lower initial investment and higher percentage gain. It is like renting stock versus buying out right. Let’s take a look.
If you bought 10 shares of UBER at $46 and it decreased in price to $44, it would result in a loss of $2 or $20 for 10 shares or a 4% loss. Silly to buy stock if you think the price is going to drop.
If you bought one Put option contract covering 100 shares of UBER’s stock with a July 30th (July wk 5) expiration date for the 44 strike, the premium would be approximately .55 per share or a total of $55 for the contract of 100 shares. If price decreased the expected $2.00 over the next few weeks to $44 target, the premium would increase approximately $1.00 to $1.55. This is a gain of $100 on your $55 investment or 181% profit. That would be a terrific trade!
It is exciting to make money if price rises or falls.
I want to remind you that you can sell to close and take profit any time along the line before the expiration date. You don’t have to hold the contract until expiration.
Options often offer a smaller overall investment, covering more shares of stock and potential for greater profits. This is like renting stocks versus having to pay full price to buy.
This said, if you are having any kind of trouble taking advantage of these trades, we don’t want you to miss out. I have put together programs that help traders just like you access the potential profits that options provide. Be sure to check out the programs (like 5-Star Academy mentioned earlier) shared in this email and we will make it easy for you to get your share.
I love to trade, and I love to teach. It is my thing.
Yours for a Prosperous Future,
Wendy Kirkland
PS-I have created this daily letter to help you see the great potential you can realize by trading options. Being able to recognize these set ups are a key first step in generating wealth with options. Once you are in a trade, there is a huge range of tools that can be used to manage the many possibilities that can present themselves. If you are interested in learning how to apply these tools and increase the potential of each trade click here.
Previous Equities discuss:
Three weeks ago, we looked at First Solar (FSLR) with July 30th expiration and 95 strike. It moved higher to 94.08 and the entry premium of 2.95 went as high as 4.50 or a profit of 1.55 or $155 and then pulled back. It dropped nearly 10% last week.
Two weeks ago, we went over Pinterest (PINS) with a July 30th expiration and 85 strike. It went as high as 81.77 and then pulled back. The premium was 3.15. It went as high as 3.90 and pulled back. It too dropped hard last week the last two days.
Last week, we zeroed in on Starbucks (SBUX) with an August 6th expiration and 120 strike and a premium of 2.06. It went as high as 3.00 and then settled back to 2.11 on Friday.


Recent Comments