Tired of waiting for a stock to find a bottom. Take a look below at how to use it for a trade with profit opportunity.
Happy Financial Freedom Friday!
I teach everyday people (like me) to trade options. I do my best to write in an understandable way as if we are talking while sitting on my deck in a relaxed atmosphere.
The market was down 4 out of 5 days last week. I am typing this on Wednesday, and you won’t get this until Friday. A lot could change in a couple days.
Advanced Micro Devices Put Potential
For today’s Trade of the Day, we will be looking at Advanced Micro Devices, Inc. (AMD).
Average Direction Index (ADX) – Strength Indicator
The Average Directional Index consists of 3 lines: Green, Red and Black.
- Green = +DI (Bullish)
- Red = -DI (Bearish)
- Black = ADX Strength Line
The DI line that is on top is in control. If the ADX line is heading up, strength is supporting the DI line that is on top and in control.
Each candle on the chart represents price movement over a 5-day (week) period; therefore, it takes weeks for trades to play out. When the -DI crosses over the +DI line, it gives a buy signal for Puts as the -DI line (red) appears as if it is in control and rising to head up on the ADX indicator, and as the ADX turns up that is even more bearish, suggesting a downward move is gaining strength. When the +DI (green line) crosses the red and the black line points up it shows an upward trend and Calls can be considered.
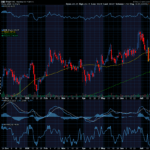
Let’s look at AMD’s weekly chart.


The ADX -DI (red line) has crossed the +DI and the black ADX line is curling up. As long as the -DI is above the +DI, price should fall. The past several weekly candles are negative. If you want to learn more about ADX, read on or, if not, scroll down to the alert.
| Potential AMD Trade – Showing Strength This signal could give a quick payout if it continues its downward move, and the strength of this pattern continues. I am typing this on Wednesday, and AMD costs about $85.30. If AMD’s price moves below $84.50 and the – DI (red line) is above the +DI, and the black line is still heading up, you could consider a Put trade. The short-term price target for AMD is $80.50 and then, perhaps, lower. With the swings in past months, I am suggesting small profit targets until a market trend starts again. |
Check Out How an Option Trade Could Pay Out Big Time
Option trading offers the potential of a lower initial investment and higher percentage gain. Let’s take a look and make a comparison.
If you bought 1 stock share of AMD, it would cost about $85.30. You would wait until it hit a bottom before you bought stock.
If you bought 1 Put option covering 100 shares of AMD with a May 20th (May 22 expiration) expiration date for the 80 strike, the premium would be approximately $3.90 today, or $390 for 1 option. If price fell to $80.50 over the next few weeks, the premium would likely increase $2.50, giving $250 profit on your $390 investment. This is a 64% gain.
Trading options is a win, win, win opportunity. Options often offer a smaller overall investment, covering more shares of stock and potential for greater profits.
I like to stress when trading options, you don’t need to wait for the expiration date to close the trade. You can close anywhere along the way prior to the expiration date. It is never a bad idea to take profit.
Trading options is like renting stocks for a fixed period of time. The potential to generate steady income with options is real, and it can be transforming.
Routinely remind yourself – I believe in myself and my ability to succeed. I believe in an abundance of unlimited possibilities. The future will be awesome!
I wish you the very best,
Wendy

Past potential trade update:
Last weeks we discussed TWTR, but the pattern didn’t confirm (no trade), and we adjusted it this week.


Recent Comments