
Happy Wonderful Wednesday!
Last week the Dow was down 4 days out of 5. The market is still pushing downwards as it hits the lows from the previous pullback. Many stocks are now touching those lows. A break below that support area (floor) would suggest we are dropping into a more bearish period.
To review past equity candidates, scroll down.
For today’s Trade of the Day, we will be looking at ProShares VIX Ultra Short Futures ETF, symbol (UVXY). Before analyzing UVXY’s chart, let’s take a closer look at the stock and its services.
ETF (Exchanged Traded Funds) are equities that are a collect of other equities, comprised of a percentage of stock from each one. UVXY is a bearish ETF. It rises when the overall market drops.
I looked through a lot of charts over the weekend. I zeroed in on UVXY on Monday because it looks ready to climb further after being up 2 weeks in a row after bouncing off support (floor). It is a widely traded ETF with lots of volume.
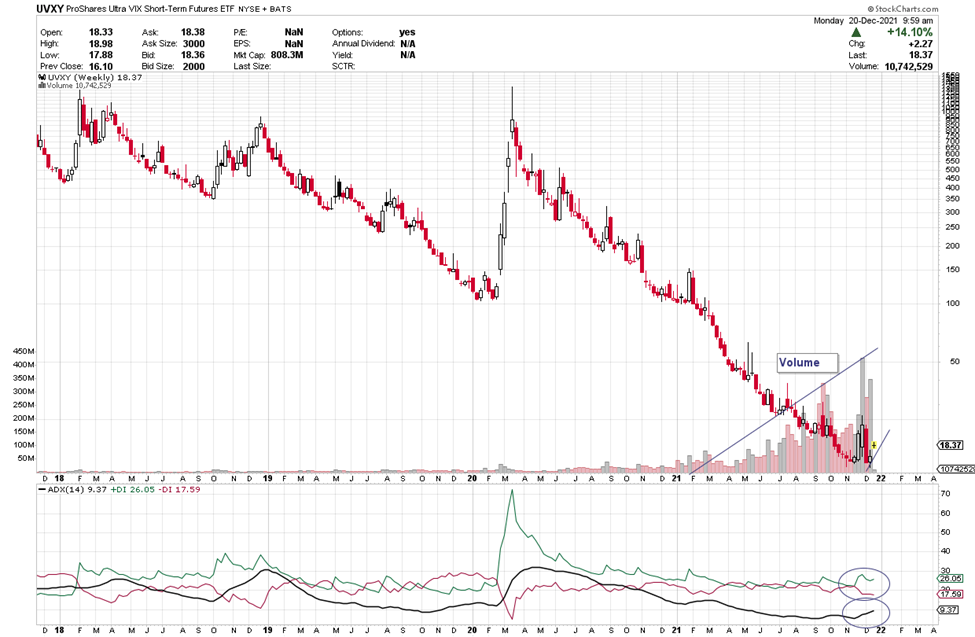
On the ADX indicator below the chart, notice how the green +DI line is on top of the -DI line (red) and the ADX. The green +DI line is above and the ADX line has turned up. These are all signals of building bullish strength with the thought that price may continue to rise.
The candles have headed up 2 weeks after a sharp pullback.
For those who want more info on ADX, I give more details in the section below, or scroll down to the trade info.
Average Directional Index (ADX) Points to Direction and Strength
ADX is an easy indicator to interpret. The +DI line (green) is bullish and when it is on top, it suggests price is going to head up. When the -DI line (red) is on top, it suggests price is going to drop.
The black line is the strength line and when it heads up, it is telling you strength is moving into the DI line that is on top and in control. When the ADX line has been heading down, the DI line on top has been weakening and is ready for a change.
When the DI lines swap places and cross up and the ADX heads up, it suggests strength is moving into the new DI direction.
ADX signal = Profit Payout
Each candle on the chart represents price movement of a week. As the +DI heads up and moves further above the black line and both rise above the red line, it suggests there is bullish strength that could continue to grow, especially once the black line starts to turn up. If price continues to rise, the ADX line (black) will continue to turn to head up to imply that strength will continue to support the trade. As long as the ADX is heading up, it means it is supporting the bullish- up direction. The opposite is true if the -DI line heads up to cross the +DI line – this suggests bearish strength and a climb in price. If the ADX line heads up while the red line -DI is on top, is it saying strength is building into the downward direction.
I am looking at its chart and possible trade on Monday, but the pattern looks as if it has gotten started will continue and the +DI may continue heading up if price keeps rising. You don’t want to consider entry if the current candle doesn’t stay above 60 or if the +DI line were to turn down and drop below the ADX.
UVXY Potential Trade
Please note and remember that I am typing this on Monday, two days before you receive it and the information, I am sharing could change over those two days and is intended to share the opportunities that options offer us.
ProShares VIX (UVXY) has been heading up for 2 weeks, suggesting it is strong. It has turned up with strength. It appears to be ready to head higher and the +DI had crossed up, if this continues, the pattern should remain intact as price keeps rising. Notice the +DI is above the -DI line on the chart above. We want the +DI to stay above the -DI (green line above red) to consider a trade. Then we’ll hope the ADX continues its upward strength.
Price is likely to rise further and move above 19 entry. Its first target is 25 as the +DI (green line) stays above and the ADX (black line) continues to head up. Its current uptrend should remain intact, and price should continue to rise, perhaps even higher. We will keep an eye on UVXY over the next couple weeks.
I am looking at charts on Monday, so prices are apt to change a little by Wednesday. Be sure the green +DI line continues to rise and goes further above the red -DI line and price stays above 19 before entry.
To buy shares UVXY today, price would be approximately 19. It would be silly to buy shares if you expect price to drop. You’d wait until it hit a bottom and started to rise again. If price stays above 19, perhaps you could buy 20 shares for $380. If price rose to $25, that would be a profit of $6 or $120 for the 20 shares or a 32% gain.
This said, option trading offers the potential of a smaller initial investment and higher percentage gain even when price is expected to rise. Let’s take a look.
If you bought one Call option contract covering 100 shares of UVXY’s stock with a January 14th expiration date (Jan wk 2) for the $25 strike and premium would be approximately $2.93 today or a total of $293 per contract. If price increased the expected $6 to $25 target over the next few weeks, the premium might increase approximately $3 to $ 5.93 per share or $300 on your 100-share contract. This is a gain of $300 on your $293 investment or a 101% gain over a couple weeks.
Remember you can close an option trade anywhere along the line before expiration to take gains or stop a loss.
Options can offer a win, win, win trade opportunity. They often offer a smaller overall investment, covering more shares of stock and potentially offer greater profits.
If you are having any kind of trouble taking advantage of these trades, I don’t want you to miss out. I have put together programs that help traders just like you access the potential profits that options provide. I write like we are having a conversation, so the information is easy to understand and apply. Be sure to check out the programs shared in this email and we will make it easy for you to get your share.
I love to trade, and I love to teach. It is my thing.
Yours for a prosperous future,
Wendy Kirkland
PS-I have created this daily letter to help you see the great potential you can realize by trading options. Being able to recognize these set ups are a key first step in generating wealth with options. Once you are in a trade, there is a huge range of tools that can be used to manage the many possibilities that can present themselves. If you are interested in learning how to apply these tools and increase the potential of each trade, click here to learn more.

Review of Past Candidates:
Two weeks ago, we studied UNP and an expiration of Dec 23rd (Dec wk4) with a strike of 255 and a premium of 2.50. On Wednesday, the price had pulled back below the level we wanted for an entry. Premium that day was about 1.58. It has not recovered. No trade.
Last week we discussed, CSCO with an expiration date of Dec 23rd (Dec wk 4) for a strike of 60 and a premium of .52. On Thursday, premium rose to 1.20 more than double in a day. On Friday, it started slipping back.


Recent Comments