
Dear Fellow Trader:
Happy Wonderful Wednesday!
Last week, the market gave us four days up and one down and Monday. The Nasdaq and S&P reached new highs within the weekly moves. The Dow now seems to be joining the party.
To review past equity candidates, scroll down.
For today’s Trade of the Day, we will be looking at Microsoft Corporation, symbol (MSFT). Before analyzing MSFT’s chart, let’s take a closer look at the stock and its services.
Microsoft Corporation develops, licenses, and supports software, services, devices, and solutions worldwide. It also offers Surface, PC accessories, PCs, tablets, gaming and entertainment consoles, and other devices; Gaming, including Xbox hardware, and Xbox content and services; video games and third-party video game royalties.
The company was founded in 1975 and is headquartered in Redmond, Washington.
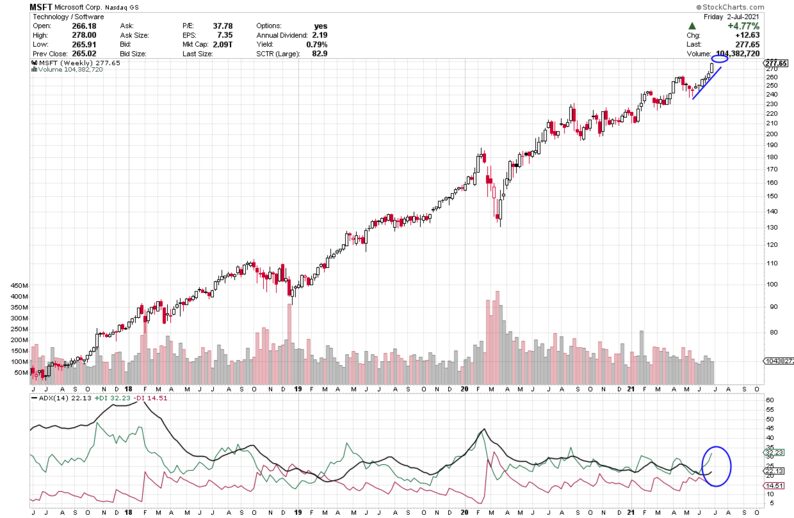
I looked through a lot of charts over the weekend. I zeroed in on MSFT because it had a pullback in April and May and has since been climbing to new highs. It is a widely traded stock with lots of volume.
On the ADX indicator below the chart, notice how the green +DI line is on top. Because of that strength, the black line is turning up to show growing strength. These are all signals of strength with the thought that it may continue to climb.
For those who want more info on ADX, I give more details in the section below, or scroll down to the trade info.
Average Directional Index (ADX) Points to Direction and Strength
ADX is an easy indicator to interpret. The +DI line (green) is bullish and when it is on top, it suggests price is going to head up. When the -DI line (red) is on top, it suggests price is going to drop.
The black line is the strength line and when it heads up, it is telling you strength is moving into the DI line that is on top and in control. When the ADX line has been heading down, the DI line on top has been weakening and is ready for a change.
When the DI lines swap places and cross up and the ADX heads up, it suggests strength is moving into the new DI direction.
ADX signal = Profit Payout
Each candle on the chart represents price movement of a week. As the + DI heads up and above the black line and remains above the red line, it suggests there is bullish strength that could continue to grow, especially once the black line starts to turn up. If price continues to move up, the ADX line (black) will turn to head up to imply that strength will continue to support the trade. As long as the ADX is heading up, it means it is supporting the bullish- up direction.
I am looking at its chart and possible trade on Monday, but the pattern should hold. You don’t want to consider entry if the current candle were to drop below the line drawn on the chart. Think of it as dropping through a floor. If that happened, you would not enter or you would close the trade.
If you are interested in learning more about the ADX strength line, I’d like to suggest you consider getting Inevitable Trend Moves. This book covers in detail how to trade the ADX to jump in during a confirmed strength stage that is as clear as looking at a picture with arrows pointing out direction.
MSFT Potential Trade
Please note and remember that I am typing this on Monday, two days before you receive it and the information, I am sharing could change over those two days and is intended to share the opportunities that options offer us.
Mircosoft (MSFT) ended the week on a bullish note with 5 up-weeks in a row. Its pattern should remain intact if price keeps rising. Notice the + DI is heading up and is well above the -DI line. We want the + DI to remain above the -DI (green above the red) to consider a trade. Green line on top is bullish.
Price is likely to rise further and eventually above 278 entry. Its first target is 290 as the +DI (green line) moves up and the ADX (black line) turns up. Its current uptrend should remain intact, and price should continue to rise, perhaps even higher to 295. We will keep an eye on MSFT over the course of the next couple weeks.
I am looking at charts over the holiday, so prices are apt to change a little by Wednesday.
The short-term price target for MSFT is $290, then, perhaps, $295, and higher.
To buy shares of MSFT today price would be approximately 278. If it reaches its near-term target of $290 that would be a rise of $12 or 4.3% profit in a short period of time. If you bought 2 shares the total cost would be $556, and you would earn $24 total on the two shares.
This said, option trading offers the potential of a smaller initial investment and higher percentage gain even when price is expected to rise. Let’s take a look.
If you bought one Call option contract covering 100 shares of MSFT’s stock with a July 30th expiration date (July 5th week) for the $290 strike and premium would be approximately $1.82 today or a total of $182. If price increased the expected $12 to $290 target over the next few weeks, the premium might increase approximately $9 to $10.82 per share or $900 on your 100-share contract. This is a gain of $900 on your $182 investment or a 494% gain over a few weeks.
Remember you can close an option trade anywhere along the line before expiration to take gains or stop a loss.
The example above is a comparison of an investment of $556 and a $24 gain versus a $182 investment and $900 profit. Big difference.
Options can offer a win, win, win trade opportunity. They often offer a smaller overall investment, covering more shares of stock and potentially offer greater profits.
If you are having any kind of trouble taking advantage of these trades, I don’t want you to miss out. I have put together programs that help traders just like you access the potential profits that options provide. I write like we are having a conversation, so the information is easy to understand and apply. Be sure to check out the programs shared in this email and we will make it easy for you to get your share.
I love to trade, and I love to teach. It is my thing.
-Wendy
PS-I have created this daily letter to help you see the great potential you can realize by trading options. Being able to recognize these set ups are a key first step in generating wealth with options. Once you are in a trade, there is a huge range of tools that can be used to manage the many possibilities that can present themselves. If you are interested in learning how to apply these tools and increase the potential of each trade, click here to learn more.
Previous Trades
Six weeks ago, we studied Facebook (FB). Two weeks ago, it climbed as high as $358.70. It is back to $354.70 as I type on Monday. It has a target of 345 with a July 16th expiration. The entry premium was $5.50 and it is now $11.80, more than double. The premium went as high as $13.
Five weeks, we checked out Advanced Medical Devices (AMD). This week, it is up to 95.27. It has an $85 target and a July 16th expiration. The premium to open was 1.92 and today as I type it is 9.65 which is a 402% gain.
Four weeks ago, we examined FCEL. It had a 12 strike and July 16th expiration. It went as high at $12.62, moving beyond its strike and then pulled back and is at 8.38 today.
Two weeks ago, we studied Apple, Inc. (AAPL)) it had a July 16 expiration and 135 strike. This week it’s premium has gone from .93 to 5.40. This is a gain of 4.47 or 480%.
Last week, we checked out Netflix (NFLX) with a July 30th expiration and 95 strike price, paying a 2.95 premium. The equity went as high as 94.08 and a 4.50 premium and then, slipped down to 2.11 with a pullback in price.


Recent Comments