
Happy Thriving Thursday!
Last week, the market was up 5 days out of 5 trading days. And, then this week has been up and down. This upward movement has brought SPY to flatten out after reaching an all-time high. It could be that it is getting tired. SPY has been up 5 weeks in a row and may need to rest or have a slight pullback.
Am going to call Thursday “SPY Day”. Each Thursday, I will focus on what SPY is doing, with the hope it will help give us a clue about the market’s upcoming moves.
SPY or the SPDR S&P 500 trust is an exchange-traded fund which trades on the NYSE Arca under the symbol SPY. SPDR is an acronym for the Standard & Poor’s Depositary Receipts, the former name of the ETF. It is designed to track the S&P 500 stock market index. This fund is the largest ETF in the world and gives a good overall picture of the market. SPY includes shares from the top 500 companies.
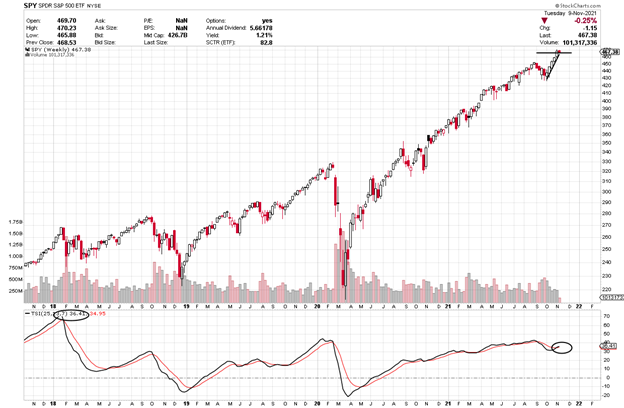
The chart of the S&P below is a weekly chart with a TSI indicator at the bottom. The description coming up next explains how to use the TSI.
True Strength Indicator
The True Strength Index (TSI) is an oscillator that fluctuates between positive and negative territory. As with many momentum oscillators, the centerline defines the overall bias. The bulls have the momentum edge when TSI is positive, and the bears have the edge when it’s negative. As with MACD, a signal line can be applied to identify upturns and downturns. Signal line crossovers are, however, quite frequent and require further filtering with other techniques. Chartists can also look for bullish and bearish divergences to anticipate trend reversals; however, keep in mind that divergences can be misleading in a strong trend.
TSI is somewhat unique because it tracks the underlying price quite well. In other words, the oscillator can capture a sustained move in one direction or the other. The peaks and troughs in the oscillator often match the peaks and troughs in price. In this regard, chartists can draw trend lines and mark support/resistance levels using TSI. Line breaks as well as line crosses can then be used to generate signals.

Plain and Simple
On the line indicator at the bottom of the chart, look how the black line dipped down, crossed down below the red line but has now flattened out to suggest it is ready to turn up. It now has a curl and is close to a cross up over the signal line. The lines are touching. The last TSI crossed down was in February 2020 with Covid, so a breach was meaningful but now it appears as if the drop has finished, it is forming a base and may soon turn up showing strength. The candles furthest to the right are the most recent weeks’ candles. This week’s candle is still black as I type and is sitting right on rising support and as moved to an all-time high.
TSI Buy Signal
Each candle on the chart represents price movement over one day. For months, the SPY has broken out and has been moving up. The TSI line dug into its signal line, created white space between the lines, dropping well below and has now flattened out and has headed up and just crossed back up. Price is at all-time highs.
Price needs to stay above the sloping line before considering a trade. Support is like a floor, and price needs stay above that level.
Below I will discuss how things can be traded if the SPY continues its upward climb.
Check out the profit potential of option trading versus buying stock. Big difference!!!
SPY is a well-rounded ETF, offering exposure to the price moves of 500 equities. Options Trade Both Directions (depending on what happens)
To buy shares of SPY today would cost approximately $467 per share (as I write this on Tuesday), but I am suggesting it may be getting tired. I have no way to know if it will break above and go down. After 5 up weeks, it seems tired and could be ready to catch its breath. Based on this, I suggest we take a break or wait until it shows where it is going next.
Option trading offers the potential of a lower initial investment and higher percentage gain. Let’s take a look and compare.
You buy call options if you expect price to go up and put options if you feel price is going to drop.
Wait until it moves above 468.50 before considering a Call trade.
If you bought 2 shares of SPY at $468.50, you would invest a total of $937. Now, if SPY were to remain above $468.50 and say, moves higher to 475, it would profit approximately $7.50 per share or $15 for the two shares or 1.6%. Not a very exciting profit.
If it drops through support at $467 to $450, you lose $17 per share or $34 for the two shares if it stopped at that level or even more if it kept dropping.
As I type this numbers are rising, so the figures below are strictly examples as I type.
Now to compare. If you bought one Call option contract covering 100 shares of stock with an Nov 29th (Nov wk4) expiration date for the $475 strike (if price rises above 468.50 before entry), the premium would be approximately $1.75 per share or $175 for the contract. If price increased the expected $7.50 over the next few weeks, the option premium would increase approximately $3 to $4.75. This is a gain of $3 per share or $300 for the 100-share contract or 171% over a short period of time.
This would be $300 profit on an investment of $175. Pretty good over a short period of time.
Option trading is truly unique in its ability to give traders the opportunity to trade an equity’s price move in either direction.
These types of trades are what can bring life-changing financial gains.
I want to stress, when you trade options, you can close the trade anywhere along the line to take profit (or loss). You don’t have to wait until it hits the target or until expiration day.
You also want to wait for the indicator confirmation and don’t jump-the-gun with an early entry.
Trading options can be a win, win, win opportunity. Options often offer a smaller overall investment, covering more shares of stock and potential for greater profits.
What’s Next? I Can Hardly Wait!
Keep an eye on your inbox and I will keep sharing what I have my eye on. If you want to get deeper into how I find these winners, be sure to check out the programs in the banners in this message to learn more about options.
I love teaching and write my strategy books as clear as I write these emails. I try to think of the questions you’ll ask before you ask them. Sign up and join me in the profit potential.
Yours for a prosperous future,
Wendy Kirkland

Past trades:
Three weeks ago, we looked at the Nov 10th (Nov 2 wk) expiration of strike 460 with a premium of 1.44. It went as high as $7.15 as I type. This is a gain of $5.71 or 396%.
Two weeks ago, we discussed Nov 19th (Nov 21) expiration of strike 465 at 1.85 per share and is now at 5.27 per share. This is a gain of 3.42 in two weeks or 184% profit.
Last week, we studied the Nov 24th (Nov wk 4) expiration of strike 465 at a premium of 2.90. Today the ask is 3.99 after the days drop. This is still a gain of 1.09 or 38% profit.


SPY is normally a great trading vehicle. It offers the most liquidity as far as options go. It makes for great scalping with options. No way I’d ever trade ES in futures again, that is super risky without placing stops on every trade. Max loss in options is the premium, really don’t need to pay more than $200/contract to get results.