
Dear Fellow Trader:
Happy Thriving Thursday!
The week started with two up days as I type this on Tuesday. That doesn’t mean there haven’t been swings and still the S&P hit all-time highs. The Nasdaq hit that all-time high mark as well and the Dow is still striving to reach that mark as well.
Am going to call Thursday “SPY Day”. Each Thursday, I will focus on what SPY is doing, with the hope it will help give us a clue about the market’s upcoming moves.
SPY or the SPDR S&P 500 trust is an exchange-traded fund which trades on the NYSE Arca under the symbol SPY. SPDR is an acronym for the Standard & Poor’s Depositary Receipts, the former name of the ETF. It is designed to track the S&P 500 stock market index. This fund is the largest ETF in the world and gives a good overall picture of the market. SPY includes shares from the top 500 companies.
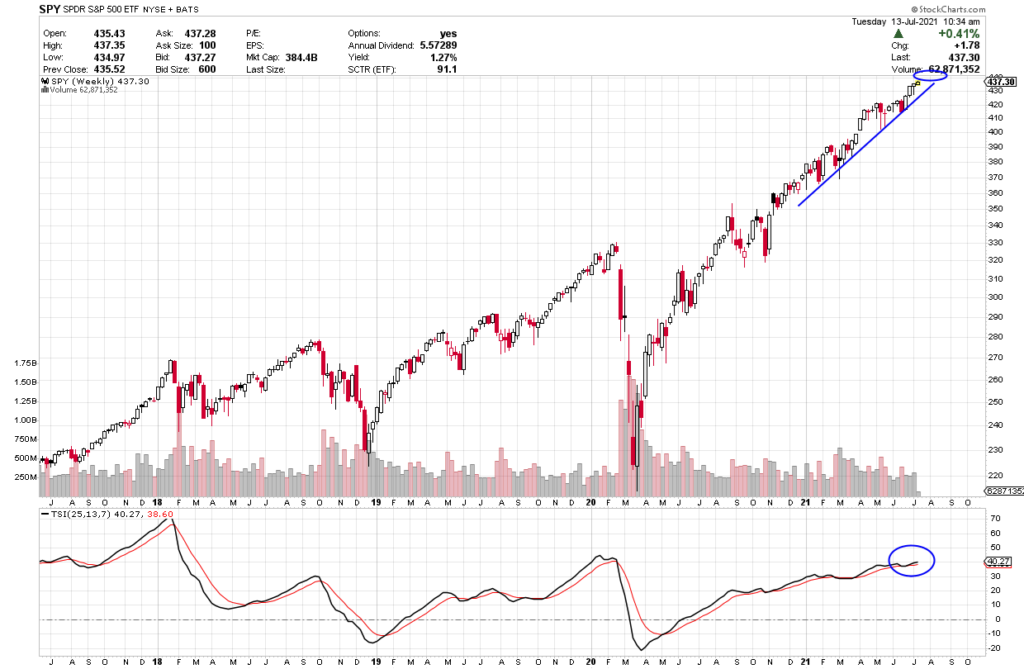
The chart of the S&P below is a weekly chart with a TSI indicator at the bottom. The description coming up next explains how to use the TSI.
True Strength Indicator
The True Strength Index (TSI) is an oscillator that fluctuates between positive and negative territory. As with many momentum oscillators, the centerline defines the overall bias. The bulls have the momentum edge when TSI is positive, and the bears have the edge when it’s negative. As with MACD, a signal line can be applied to identify upturns and downturns. Signal line crossovers are, however, quite frequent and require further filtering with other techniques. Chartists can also look for bullish and bearish divergences to anticipate trend reversals; however, keep in mind that divergences can be misleading in a strong trend.
TSI is somewhat unique because it tracks the underlying price quite well. In other words, the oscillator can capture a sustained move in one direction or the other. The peaks and troughs in the oscillator often match the peaks and troughs in price. In this regard, chartists can draw trend lines and mark support/resistance levels using TSI. Line breaks as well as line crosses can then be used to generate signals.

Plain and Simple
On the line indicator at the bottom of the chart, look how the black line dipped down and now appears as if it is sitting atop the red line and may cross down from here if it weakens further. That or it will bounce from here like a trampoline. The candles furthest to the right are the most recent weeks’ candles. Both have had nice rises.
Despite the fact that both last week and this week, SPY hit an all-time high, it appears as it will continue to climb.
TSI Buy Signal
Each candle on the chart represents price movement over one day. SPY has broken out and is moving up. The TSI line is starting to curl up.
It needs to push upward to rise further and move further above the TSI line and move up in price. If it were to break through this level, price would then drop and perhaps, take the market into a correction.
Below I will discuss how things can be traded if the SPY continues to climb.
Check out the profit potential of option trading versus buying stock. Big difference!!!
Spy is a well-rounded ETF, offering exposure to the price moves of 500 equities. Options Trade Both Directions (depending on what happens)
To buy shares of SPY today would cost approximately $434 per share (as I write this on Sunday morning).
Option trading offers the potential of a lower initial investment and higher percentage gain. Let’s take a look and compare.
You can buy call options if you expect price to go up and put options if you feel price is going to drop.
If you bought 2 shares of SPY at $438, you would invest a total of $876. Now if SPY were to remain above $438 and say, move as high as $442, it would profit $4 per share or $8 for the two shares or .9%. Not a very exciting profit.
If it drops through support at $430, you lose $8 per share or $16 for the two shares if it stopped at that level or even more if it kept dropping.
Now to compare. If you bought one Call option contract covering 100 shares of stock with a July 30th expiration date for the $442 strike (if price rises), the premium would be approximately $1.95 per share or $195 for the contract. If price increased the expected $4 over the next few weeks, the option premium would increase approximately $3 to $4.95. This is a gain of 3.00 per share or $300 for the 100 share contract or 154%.
Now, if SPY drops through the floor at $430 line and say dropped to $425 or another $5 down, you could purchase of Put Option for the $425 strike when price drops through the line at $430. The ask premium for the 425-strike put would be approx. $1.80 per share or $180. If it continued to drop to $425, the option would gain perhaps $3 in profit, increasing its premium to $4.80 per share. This is a profit of $300 for an option on an equity that is losing value.
Option trading is truly unique in its ability to give traders the opportunity to trade an equity’s price move in either direction.
These types of trades are what can bring life-changing financial gains.
I want to stress, when you trade options, you can close the trade anywhere along the line to take profit (or loss). You don’t have to wait until it hits the target or until expiration day.
You also want to wait for the indicator confirmation and don’t jump-the-gun with an early entry.
Trading options can be a win, win, win opportunity. Options often offer a smaller overall investment, covering more shares of stock and potential for greater profits.
What’s Next? I Can Hardly Wait!
Keep an eye on your inbox and I will keep sharing what I have my eye on. If you want to get deeper into how I find these winners, be sure to check out the programs in the banners in this message to learn more about options.
I love teaching and write my strategy books as clear as I write these emails. I try to think of the questions you’ll ask before you ask them. Sign up and join me in the profit potential.
Yours for a Prosperous Future,
Wendy Kirkland
PS-I have created this daily letter to help you see the great potential you can realize by trading options. Being able to recognize these set ups are a key first step in generating wealth with options. Once you are in a trade, there is a huge range of tools that can be used to manage the many possibilities that can present themselves. If you are interested in learning how to apply these tools and increase the potential of each trade, click here to learn more.

Past week’s trades:
Three weeks ago, discussed buying the 425 strike with a July 16th expiration. Price rose to 437 and the call premium rose from 3.41 per share to 12.10 as I type on Tuesday. That is $8.69 profit or $869 on the contract or 254% increase in three weeks.
Two weeks ago, we checked out the 430 strike with a July 16th expiration and a premium of 2.60. On Sunday, the premium is 7.42 or a gain of 4.37 or $437 for the contract or 185% profit.
Last week we discussed, the 440 strike with July 30th expiration and a premium of 1.94. This week the premium is 2.82 or a gain of .88 or a 45% profit in less than a week since I am looking on Tuesday.


Recent Comments