
How awesome is it to watch your call option shoot up 3x in just a couple days? A couple weeks ago Wendy Kirkland sent out an article where she had spotted a set up in Applied Materials, Inc. (AMAT) and laid out what had caught her attention about it. In just 2 days the call option she highlighted went from $2.8 to $9.5. As great as the trade was, how she spotted it using the True Strength Index was what was really important.
Take a look at the chart:
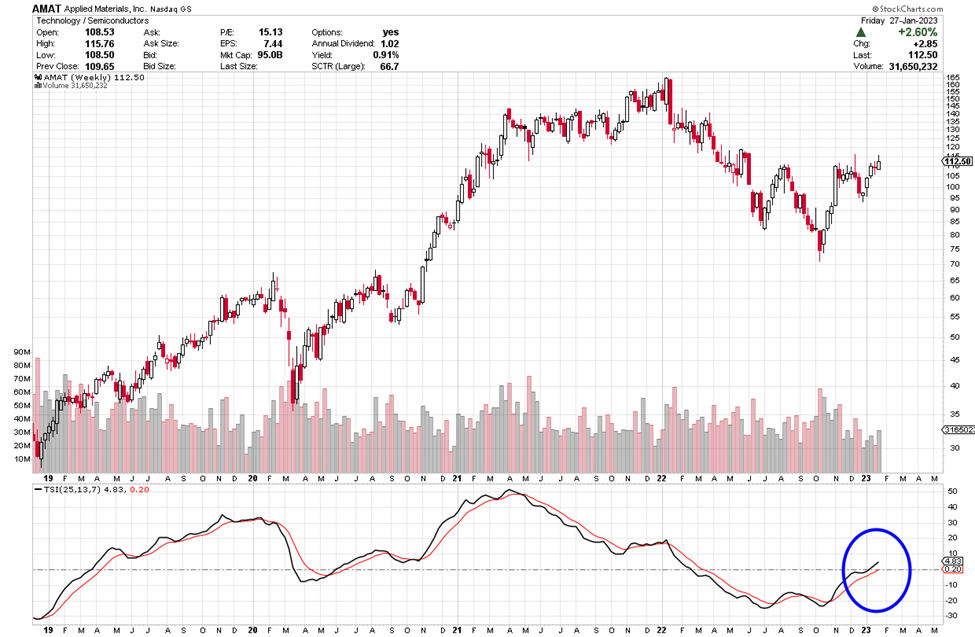

Stockcharts.com provides a great definition of the True Strength Index (TSI), which is an oscillator that fluctuates between positive and negative territory. As with many momentum oscillators, the centerline defines the overall bias. The bulls have the momentum edge when TSI is positive, and the bears have the edge when it’s negative.
As with PPO, a signal line can be applied to identify upturns and downturns. Signal line crossovers are, however, quite frequent and require further filtering with other techniques. Chart readers can also look for bullish and bearish divergences to anticipate trend reversals; however, keep in mind that divergences can be misleading in a strong trend.
TSI is somewhat unique because it tracks the underlying price quite well. In other words, the oscillator can capture a sustained move in one direction or the other. The peaks and troughs in the oscillator often match the peaks and troughs in price. In this regard, chart readers can draw trend lines and mark support/resistance levels using TSI. Line breaks as well as line crosses can then be used to generate signals.
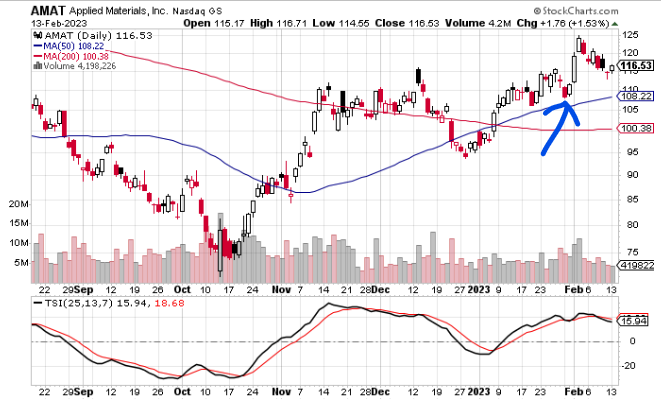
Now take a look at the daily chart of AMAT. The arrow shows when the article went out.
If you are interested in the other tools Wendy uses to spot these set ups again and again. Check out her MERIT system here. She has a way of breaking these tools down to make them as simple to use as possible. Definitely worth a click to check it out.
Keep learning and trade wisely,
John Boyer
Editor
Market Wealth Daily


Recent Comments