
Happy Fabulous Friday!
I teach everyday people (like me) to trade options. I do my best to write in an understandable way as if we are talking over the kitchen table.
Are you dizzy yet? The Dow was up 4 days last week and has been down 3 days this week as we supposedly move into a favorable time of the year for the market. December is often a bullish month. The swings has been unsettling.
For today’s Trade of the Day, we will be looking at Coca-Cola Company, Symbol (KO).
The Coca-Cola Company, a beverage company, manufactures, markets, and sells various nonalcoholic beverages worldwide. The company provides sparkling soft drinks; water, enhanced water, and sports drinks; juice, dairy, and plant-based beverages; tea and coffee; and energy drinks. It operates through a network of independent bottling partners, distributors, wholesalers, and retailers, as well as through bottling and distribution operators.
The company was founded in 1886 and is headquartered in Atlanta, Georgia.
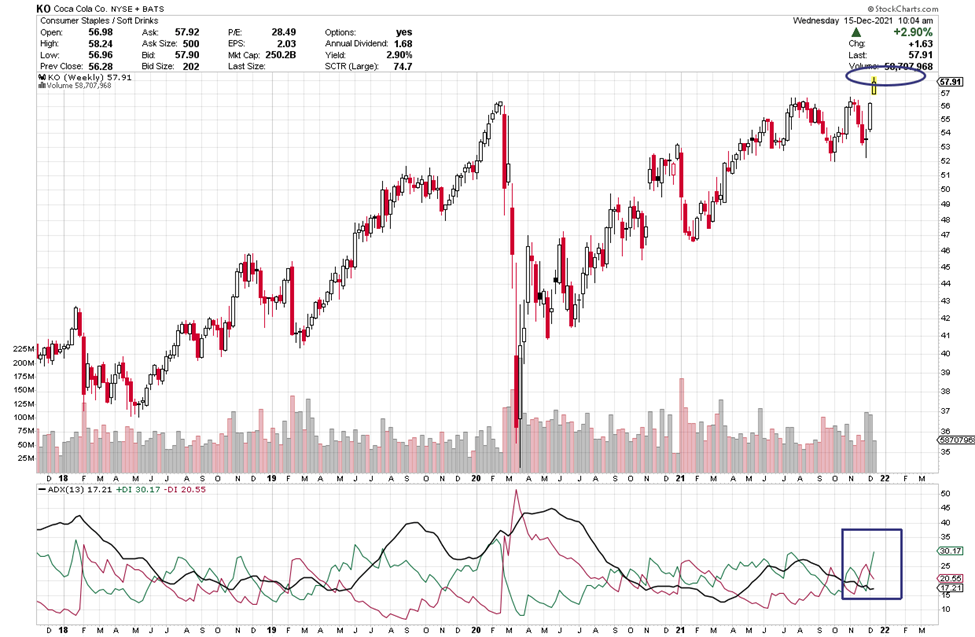
Let’s look at KO’s weekly cha.
The ADX +DI (green line) is above the -DI and the ADX line is heading straight up. As long as the +DI is above the -DI, price should rise. Green above red is an indication of strength. When the +DI is bullish and the ADX turns up, it shows strength. If you want to learn more about ADX, read on or, if not, scroll down to the alert.
Average Direction Index (ADX) – Strength Indicator
The Average Directional Index consists of 3 lines: Green, Red and Black.
Green = +DI (Bullish)
Red = -DI (Bearish)
Black = ADX Strength Line
The DI line that is on top is in control. If the ADX line is heading up, strength is supporting the DI line that is on top and in control.
Check Out the Trade Alert Signal
Each candle on the chart represents price movement over a 5-day (week) period; therefore, it takes weeks for trades to play out. On the chart, the week is a bullish candle as I type. When the +DI crosses over the -DI line, it gives a buy signal (as the +DI line (green) appears as if it is in control and rising to head up on the ADX indicator, and as the ADX turns up that is even more bullish, suggesting an upward move is gaining strength. I’d like to see the green line to continue its upward bias and then the black line to turn straight up and head up as well. All are bullish signs of strength. When the +DI crosses the ADX (black line) and when it rises, it shows a new burst of strength coming into the equity.
The Black ADX line is a strength line and as it flips up and continues to head up, it shows strength, and we’ll know strength will continue to flow into this equity. We will keep an eye KO the course of the next few weeks.
If KO’s price moves above or stays above $59, you could consider a trade. The short-term price target for KO is $65 and then, perhaps, higher. With the swings in past months, I am suggesting small profit targets until a market trend starts again.
KO Potential Trade – Showing Strength
This signal could give a quick payout if it continues its upward move, and the strength of this pattern continues. It looks as if it could push above $90. I am typing on Tuesday and KO started the day at $58+ and is heading up, if it continues above 59 showing it is moving up, a trade could be considered.
To buy shares of KO would cost approximately $59 per share and if it reaches its near-term target of $65 that would be a gain of $1 or 10%.
This is a great example of the benefits of trading options. Let’s discuss this as a study case.
Option trading offers the potential of a lower initial investment and higher percentage gain. Let’s take a look and make a comparison.
The plus DI (green line) is above the -DI and if it stays above the -DI (red) line and rises above $59 by Friday a call trade can be considered.
If you buy 10 shares at $59, you will invest $590. If the stock increases in price to $65, you will earn a profit of $6 per share or $60 for the 10 shares or about 10%.
If you bought one option contract covering 100 shares of KO with an Dec 31 (Dec qtr 21) expiration date for the $60 strike and premium would be approximately $.20 today or $20 per 100 share contract. If price increased to the expected $65 target or a gain of $6 over the next few weeks, the premium would likely increase $6 to $4.20 ($4 x 100 share contract = $400 Profit.) $400 profit on your $20 investment, this is an 2000% gain. Nice! Awesome trade if it hits it target!
Trading options is a win, win, win opportunity. Options often offer a smaller overall investment, covering more shares of stock and potential for greater profits.
I like to stress when trading options, you don’t need to wait for the expiration date to close the trade. You can close anywhere along the way prior to the expiration date. It is never a bad idea to take profit.
Trading options is like renting stocks for a fixed period of time. The potential to generate steady income with options is real and it can be transforming. Watch this video to learn how you can use option trading to achieve financial freedom. click here
Yours for a prosperous future,
Wendy Kirkland
Past Equity Candidates:
Two weeks ago, we discussed TLT with an expiration of Dec 17th (Dec 21) and a 155 strike with a premium of .68. On Friday, price moved after open from 151.58 to 155.12. The premium went up to 1.90 or 179%. In sense, this would have been a one-day trade because this week on Monday, price started dropping.
Last week, we looked at CVX with a Dec 23rd (Dec wk4) with a strike of 120 and a premium of .33. CVS price needed to move beyond 120 to consider a trade. On Friday, it only went as high as $119.20 and pulled back with recent volatility. No trade.


Recent Comments