
Happy Thriving Thursday!
Last week, the market was down 4 days out of 4 as it was a short holiday week. It was a bearish week and SPY dropped below resistance. Price dropped through the 233 EMA on Monday this week, but by close moved back above. Tuesday as I type looks like a bearish open to test those same levels again.
Am going to call Thursday “SPY Day”. Each Thursday, I will focus on what SPY is doing, with the hope it will help give us a clue about the market’s upcoming moves.
To see great ways to trade the SPY click here.
SPY or the SPDR S&P 500 trust is an exchange-traded fund which trades on the NYSE Arca under the symbol SPY. SPDR is an acronym for the Standard & Poor’s Depositary Receipts, the former name of the ETF. It is designed to track the S&P 500 stock market index. This fund is the largest ETF in the world and gives a good overall picture of the market. SPY includes shares from the top 500 companies.
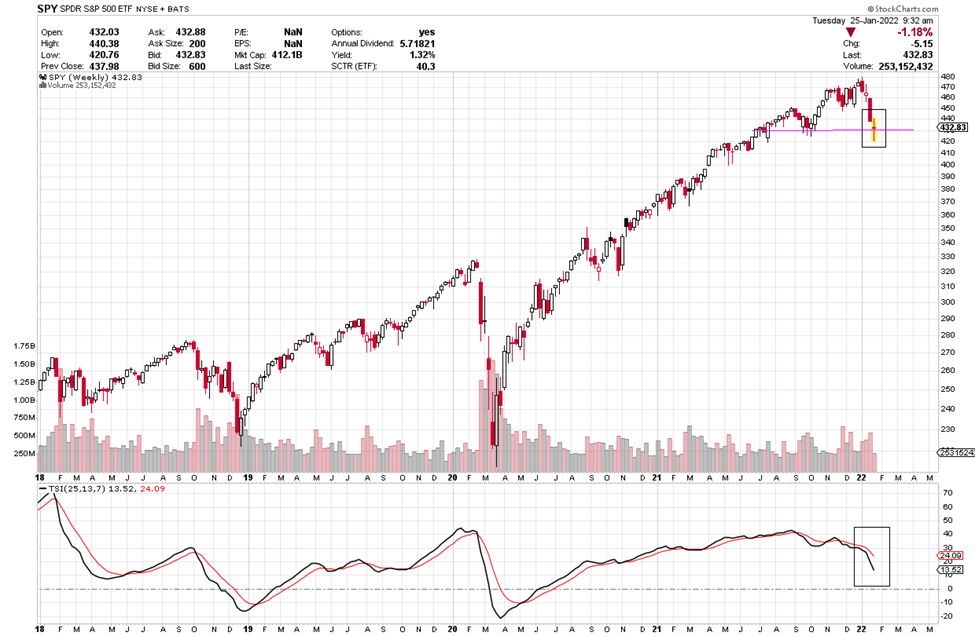
The chart of the S&P below is a weekly chart with a TSI indicator at the bottom. The description coming up next explains how to use the TSI.
True Strength Indicator
The True Strength Index (TSI) is an oscillator that fluctuates between positive and negative territory. As with many momentum oscillators, the centerline defines the overall bias. The bulls have the momentum edge when TSI is positive, and the bears have the edge when it’s negative. As with MACD, a signal line can be applied to identify upturns and downturns. Signal line crossovers are, however, quite frequent and require further filtering with other techniques. Chartists can also look for bullish and bearish divergences to anticipate trend reversals; however, keep in mind that divergences can be misleading in a strong trend.
TSI is somewhat unique because it tracks the underlying price quite well. In other words, the oscillator can capture a sustained move in one direction or the other. The peaks and troughs in the oscillator often match the peaks and troughs in price. In this regard, chartists can draw trend lines and mark support/resistance levels using TSI. Line breaks as well as line crosses can then be used to generate signals.
TSI Buy Signal
Each candle on the chart represents price movement over one week. On the line indicator at the bottom of the chart, it appears that the TSI line is turned down indicating a bearish move. There is more white space between the lines than last week. The red line is still above the black. The candle for this week is currently red. All these things are indicative of a bearish trend.
Price needs to move above the overhead line to consider a Call trade. Support is like a floor and resistance is like a ceiling, and price needs rise above that level.
Check out the profit potential of option trading versus buying stock. Big difference!!!
Potential Profit Play:
To buy shares of SPY today would cost approximately $433 per share (as I write this on Tuesday) just after open.
Option trading is truly unique in its ability to give traders the opportunity to trade an equity’s price move in either direction. On Monday, SPY looked like it may have found a bottom and was going to recover for a period of time and then On Tuesday on open it dropped again to test that same area. I am going to list boundaries, it if moves above 435 consider a call trade. If it drops below 430, you could consider a Put trade. If it stays in between that $5 range, we could say, it is stuck and don’t enter a trade. The bias still looks to be to the downside.
I want to stress, when you trade options, you can close the trade anywhere along the line to take profit (or loss). You don’t have to wait until it hits the target or until expiration day. You also want to wait for the indicator confirmation and don’t jump-the-gun with an early entry.
If SPY’s price continues to go down through $430 and the TSI shows a downward trend, you could consider a 420 Put trade. If you bought the $420 strike Feb 11th expiration as of today it would cost around $9. If price fell to the expected $420 target you could expect a possible $5 gain on your premium or a 55% profit.
Trading options can be a win, win, win opportunity. Options often offer a smaller overall investment, covering more shares of stock and potential for greater profits.
What’s Next? I Can Hardly Wait!
Keep an eye on your inbox and I will keep sharing what I have my eye on. If you want to get deeper into how I find these winners, be sure to check out the programs in the banners in this message to learn more about options.
I love teaching and write my strategy books as clear as I write these emails. I try to think of the questions you’ll ask before you ask them. Sign up and join me in the profit potential. Click here to start now!
Yours for a prosperous future,
Wendy Kirkland

Past Trades:
Last week, we discussed a Put trade with a 450 strike and a Feb 2nd expiration with a premium of $5.63. On Tuesday at open, the premium for the 450 strike put was 22.30, which means the trade earned a 296% profit. Awesome!


Recent Comments