
Dear Reader,
When I’m sorting through a group of stocks to identify which ones may be strong candidates to be added to my ‘Buy List’, I have a handful of technical indicators that I will use to help me filter down to the best looking setups.
Just this morning, one stock popped up on my screen that met many of my criteria and warranted being added to the ‘Buy List’.
The stock that caught my attention was Tanger Inc., symbol: (SKT).
When I saw SKT’s stock chart, there were a number of things from a ‘technical perspective’ that I like to see. The stock is clearly in a long-term uptrend and meets many of my technical ‘Buy’ signal indicators. However, at any given time there could be hundreds of stocks that satisfy just these basic criteria.
Well, since this stock meets many of my more base-level technical mile-markers, I need to have some additional tools in my tool kit to help me parse through all the signals to separate ‘the best from the rest’. So, you may be asking, “What sets this stock apart from the rest of the bunch?”.
This is the right question! And the answer is that the stock is not only in an unquestioned uptrend, but SKT also has confirmed momentum in the buying pressure underwriting the stock’s move.
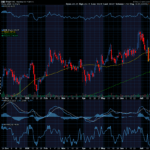
Let’s check out the technical breakdown of SKT stock in the chart below and I’ll tell you what in this chart has me so excited!

Looking more closely at the chart, we can clearly see that SKT stock is in a definitive uptrend (circled). But what is so exciting about this chart is what’s shown in the lower portion of the chart, the ‘On Balance Volume’ line.
On Balance Volume measures volume flow with a single Easy-to-Read Line. Volume flow precedes price movement and helps sustain the price uptrend. When a stock closes up, volume is added to the line. When a stock closes down, volume is subtracted from the line. A cumulative total of these additions and subtractions form the OBV line.
Once I identify a stock, like SKT, with a clear uptrend, I will check the stock’s OBV chart to seek confirmation of the stock’s trend.
You can see in SKT’s OBV chart, the stock’s OBV line is clearly trending up which signifies that the stock’s buying pressure is exceeding its selling pressure which validates SKT’s ‘Buy’ signal. As long as the OBV line continues to trend upward, this provides support to help sustain the stock’s bullish run.
 Recently, this newsletter sent alerts to members that gave them the chance to take trades that made as much as 90.5% & 146.5%. Now I cannot promise that you’ll win every trade… But I can promise you that this is one great opportunity! To begin receiving these alerts today for JUST $1, CLICK HERE to sign up!
How I Would Look to Trade It
Now that we have become aware of SKT’s bullish breakout higher, the next thing we want to search for is an attractive trading setup for the stock.
Of course you could simply buy the stock shares, which we sometimes do, but, many times when we spot a setup like this we want to add a bit more leverage to our position to unlock more explosive profit potentials.
With a setup like this, we like to find a call option to purchase which would provide us with a little more leverage on our trade. By doing this, should the bullish trend continue, our trade is positioned to produce higher profits when compared to just owning the underlying stock shares.
When selecting which call option to purchase, I often rely on my 1% Rule to help narrow down my choice of option strikes. The 1% Rule helps me select an in-the-money option that has a higher probability of producing a profit when compared to an at-the-money or out-of-the money option. Once I have one selected I will vet the trade using my Call Option Purchase calculator to determine the trade’s profit potential.
Below is a snapshot of my Call Option Purchase Calculator that shows the profit potential analysis for my trade. This example examines a range of SKT shares remaining flat up to a 12.5% increase at option expiration.

87.4% Profit Potential for SKT Option
The trade analysis shows that if SKT shares were to increase by just 1% at option expiration, this trade would make 5.4%.
Then looking at a few of the bigger potential moves, if SKT shares were up 5.0% at option expiration, our option would be set to profit 41.9%!
If that doesn’t sound good enough, get this, if SKT shares were up 10.0% at option expiration, this call option would be set to produce an 87.4% profit! That means the call option would outperform the stock nearly 9 to 1!
By following my 1% Rule to select which call options to purchase, this has helped me in the past to juice my trade’s profit potential, just like in the example shown above. Additionally, the 1% Rule helps to increase the odds that the option will profit as the underlying stock only has to increase by 1% for the option to begin profiting.
The Hughes Optioneering Team is here to help you identify high-probability trades just like this one.
Check out Chuck’s PRO Trading Service!
I don’t want you to miss a single opportunity to potentially reach your goals. That’s why I want to share this video I made about my PRO Trading Service.
I want you to follow in my footsteps for the opportunity to succeed beyond your wildest dreams, so please call my office at (737) 292-4425 and get started today!
Wishing You the Best in Investing Success,

Chuck Hughes
Editor, Trade of the Day
Have any questions? Email us at dailytrade@chuckstod.com
*Trading incurs risk and some people lose money trading.


Recent Comments