Friday, September 10th, 2021
Happy Fabulous Friday!!
I have put together a few articles about key indicators that I use often and are extremely helpful when you are identifying the symbols that are setting up for a big move. These indicators can also be very helpful when tryin to identify a price target to use when building an option trade.
The knife is one of the oldest and most useful tools ever invented, but the Swiss Army knife took that tool and made it a small miracle. That is very similar to what happened when traders started modifying the Moving Average to use an Exponential Moving Average.
Moving Averages have been applied to many things but they are used on almost every chart in trading. The concept is that if you look at the average price over a set number of trading periods, you will start to see how that price is moving and be able to more accurately predict where it will go.
Exponential moving averages (EMAs) reduce the lag seen in simple moving averages by applying more weight to recent prices. The weighting applied to the most recent price depends on the number of periods in the moving average. We are applying 8, 21, and 55 weekly periods for our entry signals. EMAs differ from simple moving averages in that a given day’s EMA calculation depends on the EMA calculations for all the days prior to that day. You need far more than 10 days of data to calculate a reasonably accurate 10-day EMA.

There are three steps to calculating an exponential moving average (EMA). First, calculate the simple moving average for the initial EMA value. An exponential moving average (EMA) has to start somewhere, so a simple moving average is used as the previous period’s EMA in the first calculation. Second, calculate the weighting multiplier. Third, calculate the exponential moving average for each day between the initial EMA value and today, using the price, the multiplier, and the previous period’s EMA value.
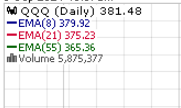
Take a look at the EMA on a chart of QQQ, the ETFF that follows the NASDAQ:
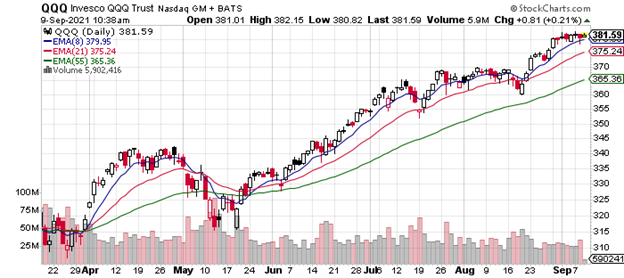
You can see that when the shorter time frame, 8 period EMA shown in black crosses above the longer term 21 and 55 period EMAs back in April and May, it signaled and confirmed a reversal. Likewise, when it crossed below it alerts us to a move to the downside.
With an early alert to the direction a stock or ETF is moving it gives us a great heads up to set up a potential winner with a high likelihood of success.
In addition, the EMAs can provide us great targets for where a stock or ETF will hit resistance or find support. This allows us to create really effective options trades and greatly improve our success rate.
I go into EMAs in more detail in my MERIT program and you can see how it all comes together in the video below.
I love teaching and sharing. It is my “thing”.
Yours For A Prosperous Future,
Wendy Kirkland
PS-I have created this daily letter to help you see the great potential you can realize by trading options. Being able to recognize these set ups are a key first step in generating wealth with options. Once you are in a trade, there is a huge range of tools that can be used to manage the many possibilities that can present themselves. If you are interested in learning how to apply these tools and increase the potential of each trade, click here to learn more.

(Click the video image to start)


Recent Comments