If you have been driving for a while you know what an idiot light is. It’s that red light that lights up on a dashboard when something is wrong with the car. It got the name from the fact that it didn’t give any additional data, it was simply bianary. On or off. If you were lucky enough to have gauges, you could see that the car was starting to overheat or you were losing oil pressure.
Times have changed. Now it is a check engine light that tells you to check a code and get a much more specific piece of information that could be anything from the gas cap is off or the engine is shot.
Well the market has been flashing an idoit light at us for the past few months. Not unlike an old car, we can choose to ignore it and when it goes off we can assume the car miraculously fixed itself, or we can do some further diagnosis. Let’s pop the hood and take a look at the chart:
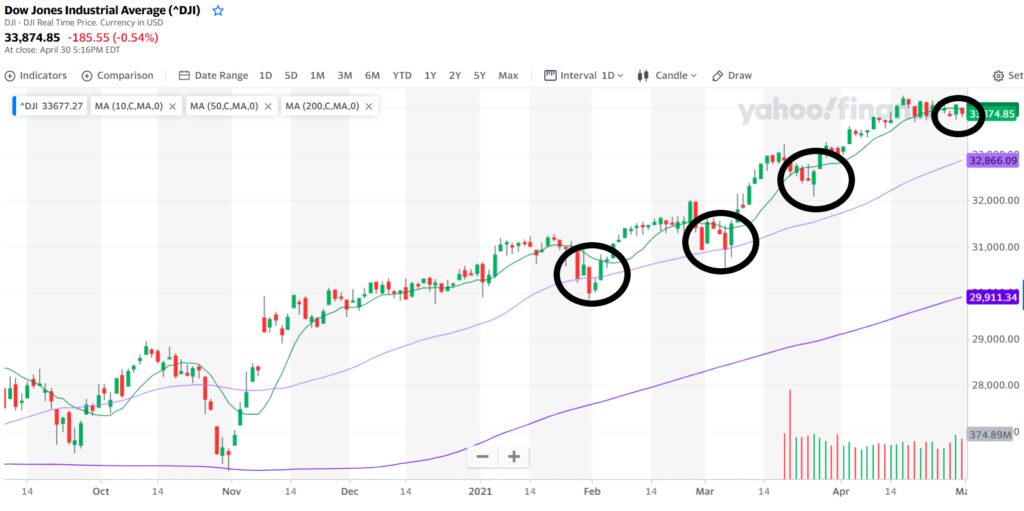
Each circle is the light flashing telling us that we are breaking support at the 10 day moving average. If we close below the moving average, it is similar to hearing the engine start to click. A second sign confirming something isn’t right and we should dig deeper.
If you look at each of these, you can see we were able to recover and keep on driving to Disneyworld with the whole family happy as can be. At some point, we are going to throw a rod and be on the side of the road.
Or, we can use these signs and plug in a code reader, like some momentum indicators, and get an idea of whether the problem is just a gas cap or something more serious.
Think of Joe Duffy’s Little Black Book of Momentum Setups as the code reader. It can keep you from being stranded and suffering a very costly repair or it can tell you it is just a temporary correction and to stay long and have some extra dough for your vacation.
Do yourself a favor and grab Joe Duffy’s Little Black Book Of Momentum Setups. Plug it in to your trading dashboard and make sure you are on the right route.
Keep learning and trade wisely,
John Boyer
Editor
Market Wealth Daily


Recent Comments