
Happy Financial Freedom Friday!
I love these Friday’s as we discuss option trading. I am all about “Knowing”. Above and beyond what you are learning about the option trading process, is knowing you are in the right place, at the right time, reading the right information or selecting the right equity at the right strike price. Knowing brings a high level of positivity compared to stressing and worrying you have likely made a mistake. Which do you think is apt to have the better result? You’ve got this. Let’s jump in.
Here’s What Is Covered Below:
- Overall Market Information – Website
- Market Indices
- Sectors – Exchange Traded Funds
- How to zero in!
Today, I am going to post a number of images from a free website that helps to give a quick, clear picture of what is taking place in the market throughout the day.
FinViz.com is a free website. Yes, there is a subscription version which doesn’t have all the pop-up ads, etc., but I’m not suggesting you enroll because it isn’t like you are spending all day on the site. If you were using the site to analyze charts or search for equities, enrollment might be a consideration, but for today’s discussion I am just drawing your attention to the quick picture and information you can gain off the free site and a quick look at the front page.
I use this site daily. If I am looking at individual charts throughout the day, answering emails or writing a newsletter and I want to check to see what the market is doing, I click on FinViz.com.
This is the image on their front page.
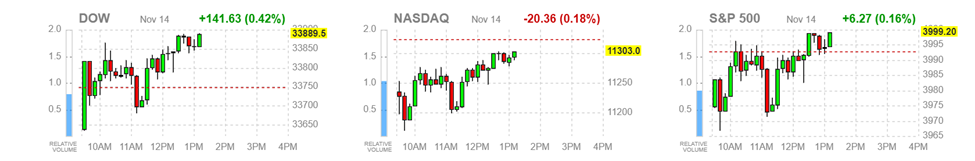

You have all 3 main indices, the Dow, Nasdaq and S&P. Each of the candles represents 10 minutes of price movement. It is easy to see and take in that the Dow has had lots of swings up and down, but, at the moment, it is up and near the high of the day.
On the other hand, the Nasdaq is negative and that said, it is recovering and near the high of the day but still a minus number, red. I am typing this during my lunch-period, so you can see we are in the middle of the trading day. The S&P is positive, and its gain or move up is less than the Dow and more than the Nasdaq.
The figures at the top show the day’s gains/losses up to the moment as well as the percentage of price move of the total of the indices’ price. In a very general sense, this is easy to read and gives a quick clear picture of what is taking place within the day’s trading.
There is also other information on this website’s home page. Again, I will post an image below of the Industrial Sectors of the market. This, too, is also a very easy image to take in and digest the information.
There are 11 Sectors and each is divided by a white square, with the Sector Industry listed at the top– Technology, Communications, Financial, Healthcare, etc. Listed within each sector are the individual companies. You can tell by the color (red/green) if the company’s price is down or up for the day.
The image gives a quick overview. Without spending, too, much time, you can see that Healthcare is doing well today and is the greenest, Industrials and Energy are not, too, far behind. The brighter or lighter the green, the higher percentage of gain.
It is the same for the Sectors that are bearish or down, they will have the brightest red color shades. Real Estate and Consumer Cyclicals appear to be the reddest or have the most “larger” companies in the red.
The size of the company’s box also shares information on the weight of the company within the Sector. It is easy to see Apple. Google, Microsoft, Amazon,

Walmart, Johnson & Johnson, and Visa are some of the biggest corporations being tracked.
Now, if you click one of the company’s symbols, it will bring up even more detailed information. I’ll click Microsoft and post its image. It tells its price, shares a small image of its chart movement, and compares it to other equities within its Industry.

The page also shares Major News and recent quotes.

As mentioned on the free site, ads pop up, but I usually just spend a few minutes now and then, to check what is going on in the Big Picture and then, I go back to looking at the individual charts of my trades or companies I am considering for a trade.
I hope you find this site useful.
Friday is education day. My goal is to teach everyday people (like me) to successfully trade options. I do my best to write in an understandable way as if we are talking while sitting on the deck of my house in a relaxed atmosphere.
The trading tools you select, and use are important, and can make your trading easier and more effective.
Don’t let option trading scare you. It is human nature to unthinkingly carry fears, concerns, problems, and feelings forward, as if the struggles you have today will follow you into the future. Rather than create a future that very much resembles today, instead know that every day will bring clarity and greater understanding of what you are studying about option trading. It is like climbing a ladder where each step brings clarity to what once seemed far away. You can do this!
I wish you the very best,
Wendy


Recent Comments