From Keith Harwood, OptionHotline.com
Perhaps it’s time to accept a holiday rally into the end of year, as many signals are aligning.
Two weeks ago, I was looking at some potential upside in technology, and while it lasted for about a week, we had a short-term top a week ago, which was signaled by the VIX. Basically, we’re seeing the market give little moves on a weekly basis while looking for a bigger trend.
And right now, there are some signs that the bigger trend is forming!
To see this, we need to look at a few leading indicators for what’s been driving the bear market as well as for what has been indicating that a bull market may be starting.
First, let’s look at what has been driving the bear market: inflation and interest rates. Our first and primary inflation indicator for daily markets has been oil prices. So, let’s look at USO:
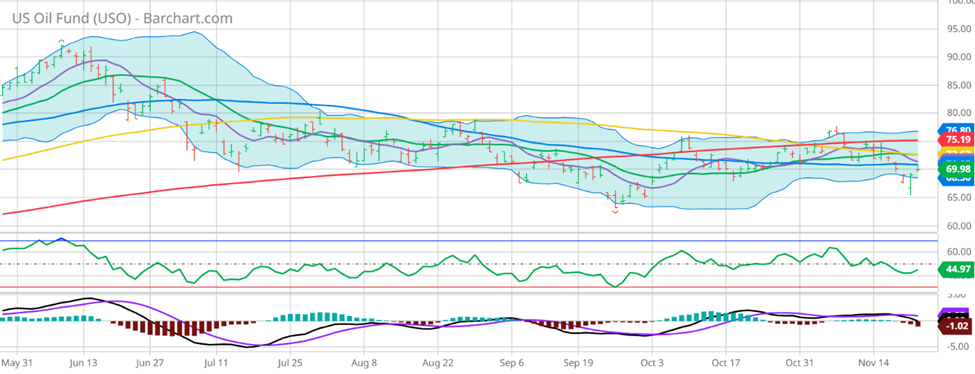

Oil has been rangebound for months, nearly collapsed on Monday, recovered, and is back in its range. Is this the perfect scenario for oil as it relates to inflation as well as expected global growth? If oil falls too far, it could indicate a lack of demand and a global slowdown. If it rises too fast, interest rates have to rise to fight inflation and that could cause investors to move away from risky stocks to invest in lower risk bonds that have an attractive yield. Let’s look at TLT, the ETF representing 20+ year treasury bonds to see how long-term interest rates are changing:
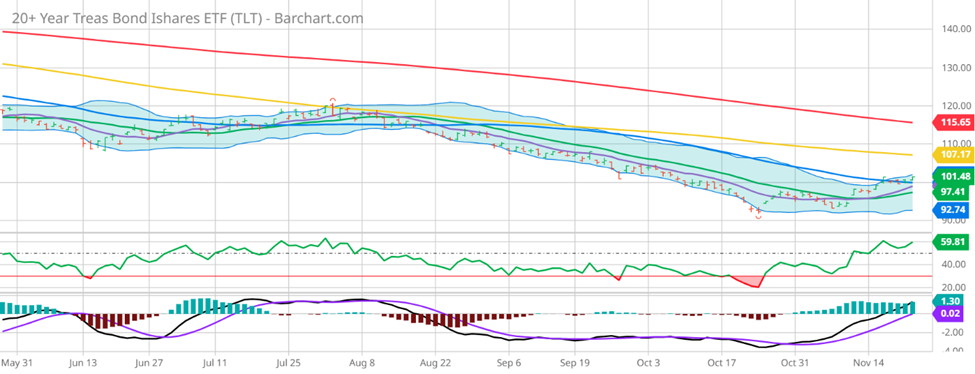
Bonds stopped going down as interest rate expectations stopped going up. Perhaps that equilibrium in oil is telling us that inflation is well enough under control and global growth still looks good at current treasury yields. That’s an equilibrium I like to see for a potential return to tech investment, especially if long-term bond yields continue to drift lower and indicate greater confidence for long-term investors.
To see if the market agrees, let’s look at the chart of QQQ, the NASDAQ 100 ETF:
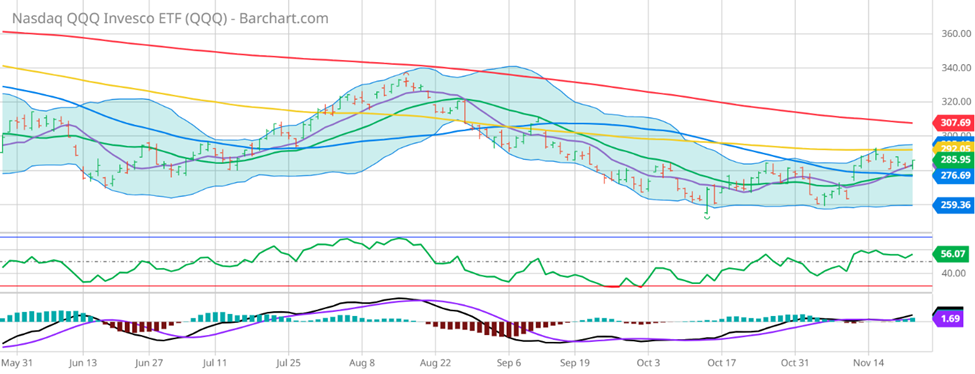
QQQ had a short-term top a week ago, but now looks ready to recover and potentially start a new trend to the upside, especially given the shallow break. QQQ can’t seem to break below the short-term 10-Day Moving Average. The 50-Day Moving Average seems to be strong support. A move through the 100-Day Moving Average would be that much more bullish.
And, to top it off, the VIX is getting very low, which means options leverage is getting cheap:

All these elements combined are telling me it could be time to bet on the holiday rally. Equilibrium in interest rates and inflation seems to have been found, yielding less uncertainty and greater potential upside with cheap options! This sounds like a winning combination to me!
So please go to http://optionhotline.com to review how I traditionally apply technical signals, volatility analysis, and probability analysis to my options trades. As always, if you have any questions, never hesitate to reach out.
Keith Harwood
Keith@optionhotline.com


Recent Comments