by Adam Oliensis
We use volume as a secondary tool, one that can provide confirmation or non-confirmation (divergence).
On Balance Volume
On Balance Volume (OBV) is a cumulative total of each day’s volume. When the closing price increases, that day’s volume is added to the cumulative total. When the price declines, volume is subtracted from the total. A formula for OBV is:
RunTot(IF C > C[-1] THAN V ELSE IF C < C[-1} THEN –V ELSE 0
Where RunTot adds today’s value to the previous days’ value.
C = Closing Price
V = Volume
C[-1] = The prior period’s closing price (yesterday on a daily chart).
In English, the formula above reads like this: If today’s close is greater than yesterday’s close, then add today’s volume to the running total. If today’s close is less than yesterday’s close, then subtract today’s volume from the running total.
Below is what it looks like on a Dow Jones Industrial (DJ-30) chart.

The OBV line (in the lower pane) shows some interesting features. First, in Box A it confirms the strength of the downtrend, making a series of lower lows and lower highs. Then, in Box B it shows us that the bounce off the late July low is not very strong. The pattern on the OBV line is slower to begin a significant retracement of the decline than is the price. Finally, in Box C, OBV confirms that the bounce up is failing as it makes lower lows and then lower highs, suggesting further downside movement.
We use OBV to see if volume is confirming or diverging from price action. While this indicator can be useful, it’s still a bit crude. For example, if a stock closes up by $0.10, all the volume gets counted as bullish. The OBV line responds to a rise of $0.10 by exactly the same amount as it responds to a rise of $1.00.

On a high volume Doji candle (in which the opening and closing price are very close to one another), OBV can be somewhat misleading, depending on whether the stock closes up or down by just a few clicks. OBV is valuable in that it gives you something of interest almost every day. However, the indicator lacks some nuance, some ability to represent markets that are ambivalent, and to distinguish those from markets that are more galvanized in a particular direction.
Accumulation/Distribution
TheAccumulation/Distribution (A/D) Line makes some effort to account for markets that might be speaking more subtly.
The Accumulation/Distribution Line is the running total of weighted volume. The A/D Line, or Volume Accumulator, was developed by Larry Williams and is a modification of the On Balance Volume indicator.
RunTot((((C – L) – (H – C))/(H – L)) * V)
Where RunTot = Running Total
C = Closing Price
L = Low of the period
H – High of the period
V = Volume
Instead of assigning all the volume to either the buyers or the sellers, the Volume Accumulator uses a proportional amount of volume corresponding to the relationship of the closing price to the intraday mean price. If prices close at the high or low of the day all volume is given to the buyers or sellers as in the OBV calculation. The assumption is that the closer the closing price is to the high the more accumulation is occurring, while a close near the low indicates distribution. Weighting the volume by this percentage indicates the importance of the accumulation or distribution that is occurring.
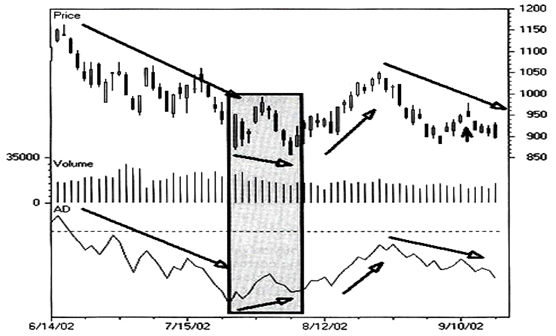
A/D is interpreted in much the same way as OBV. Below is what it looks like on a Nasdaq 100 Index (NDX–X) chart.

As you can see, the AD line confirms the downtrend at the left of the chart with lower lows and lower highs. Then something interesting happens. In the grey box, NDX makes a low, bounces, and then makes a lower low. Meanwhile, also in the grey box, the AD line makes a low, bounces, and then makes a HIGHER low. Note the upward slanting arrow in the AD pane and the downward slanting arrow in the Price pane. That’s a bullish divergence on the AD line that augurs bullish. And, indeed, the NDX goes on to rally from the mid 800s up to about 1050 toward the end of that summer.
On the right side of the chart, the AD line confirms that the late summer rally is nothing to write home about, as it appears even less significant in the AD pane than in the Price pane.
The AD Line is, in my eyes, generally an improvement upon OBV. AD is able to respond with some sensitivity to the magnitude of a price move, as well as to the volume that supports it. However, AD is sensitive only to where in a stock’s periodic (daily) trading range it closes, and not at all to where it closes relative to its prior candle. So, for instance, a stock that gaps up and then closes at its daily low will be considered to have distributed all its volume. It gets no credit for the fact that it may have closed up from the prior day’s close by $3.00. Now, intuitively that makes one kind of sense, but it also seems wrong-headed in light of the fact that there had to have been quite a bit of buying pressure in the stock in order to keep it from filling its opening gap.


Recent Comments