

After last week’s wild drop, we are heading into a brittle trading environment. I have a specific indicator I use for highly over extended markets (either overbought or oversold) to get a sense of when it is about to break.
It couples perfectly with my Shark Fin trading pattern and it is displaying a pattern that is extremely telling about the moves we saw last week.
Some are calling this a top and urging people to sell but we have seen these pullbacks repeatedly for a long time in this current rally. Which is it?
Let me walk you through this indicator so you can look at your charts from a much more informed position.
Channel Commodity Index
Trying to know when to enter or exit a trade can be overwhelming. Using an effective tool to determine when a stock is overbought or oversold can make that much easier.
Stockcharts.com provides a great definition of the Commodity Channel Index (CCI), which is a versatile indicator that can be used to identify a new trend or warn of extreme conditions. Originally, it was developed to identify cyclical turns in commodities, but the indicator can be successfully applied to indices, ETFs, stocks and other securities. In general, CCI measures the current price level relative to an average price level over a given period.
CCI is relatively high when prices are far above their average but is relatively low when prices are far below their average. In this manner, CCI can be used to identify overbought and oversold levels or breaks from one level to another.
A move down to the CCI -100 or the zero line can issue a Put entry signal as it moves from being bullish to bearish. A move toward -100 is a continuation of that bearishness. Up through the 100 line creates a green fin of bullishness until it drops back down through the -100 line. Take a look at what we see the CCI tell us about Friday’s QQQ Chart
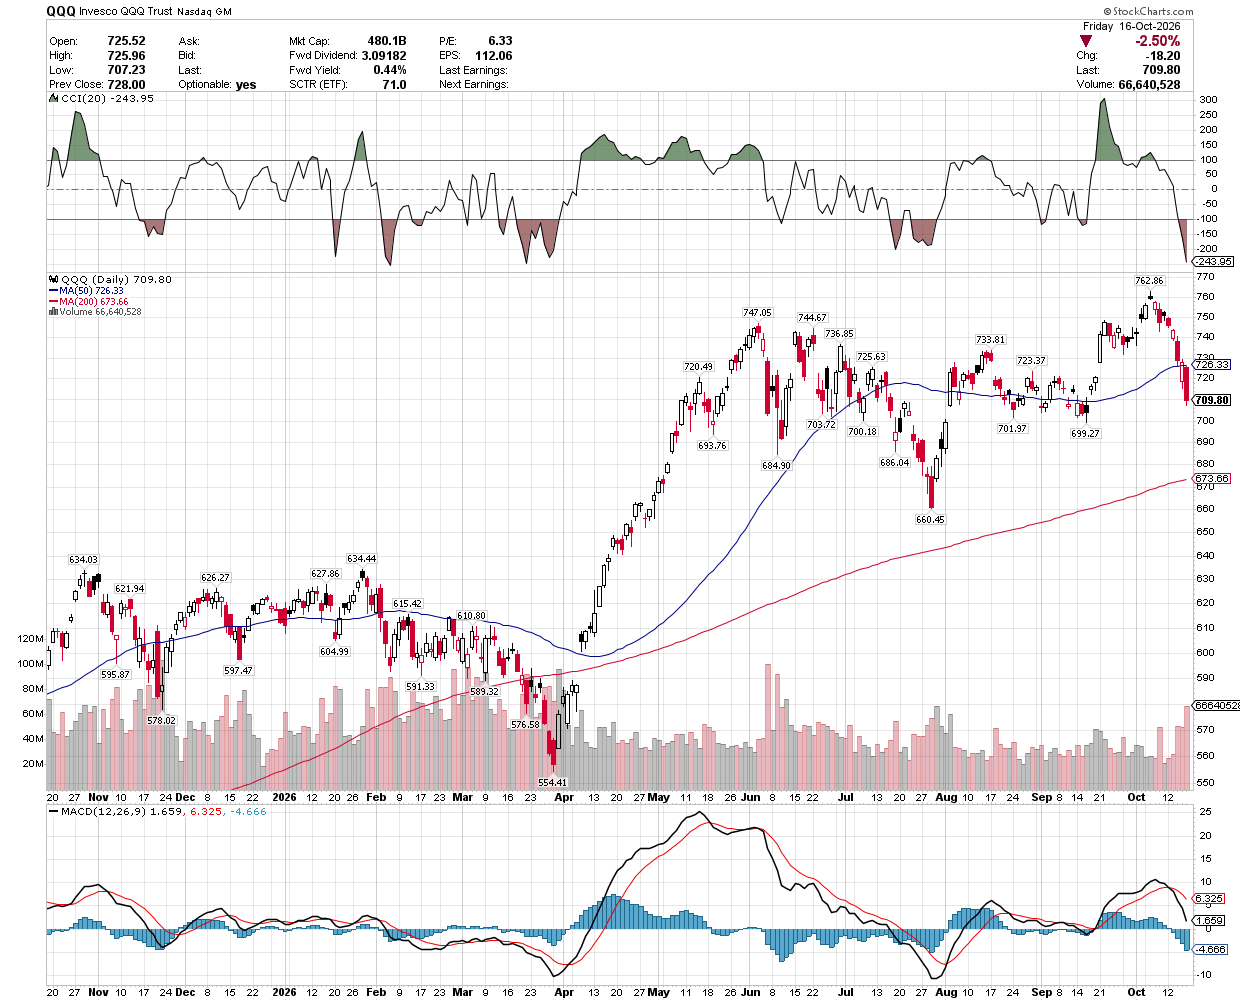

A break below the zero line means it has gone from bullish to bearish and a drop below -100 suggests even more bearishness.
The sharp, fin shaped points on the CCI on the chart above are great examples of clear signals when a stock is overbought or oversold. The lowest or highest point is a sign to watch and then a subsequent move closer to 0 will be a potential entry or sell signal.
If you are looking for more information to help spot buy and sell signals that have a high probability of winning, check out my Shark Fin Trading program. You can get more information about it here.
Yours for a prosperous future,
Wendy Kirkland










Recent Comments