
Dear Reader,
Yesterday, we looked at a Daily Price Chart of the Industrial Select Sector SPDR ETF, noting that XLI has been making a series of new 52-Week Highs recently.
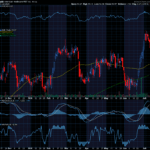
For today’s Trade of the Day we will be looking at a Keltner Channel chart for the SPDR S&P Homebuilders ETF, symbol: XHB.
Before breaking down XHB’s daily Keltner Channel chart let’s first review the investment objective of the ETF.
The XHB ETF seeks to track the performance of the S&P Homebuilders Select Industry Index, the fund employs a sampling strategy. It generally invests substantially all, but at least 80%, of its total assets in the securities comprising the index. The index represents the homebuilders segment of the S&P Total Market Index.
Now, let’s begin to break down the Keltner Channel chart for XHB. Below is a Daily Price Chart and the three Keltner Channels for the XHB ETF.

Buy the XHB ETF
The Hughes Optioneering Team uses the Keltner Channels as an indicator to determine whether an ETF is overbought or oversold. If an ETF’s daily price is trading above the upper Keltner Channel, this signals that the ETF is temporarily overbought and subject to a retracement.
Even ETFs that are in the strongest bull trends do not advance in a straight line. There are always price retracements along the way. When an ETF becomes overbought, it’s price will typically decline soon after as the inevitable profit taking occurs.
The XHB daily price chart shows that the ETF is in a strong price uptrend and has become overbought several times. You can see this as XHB has traded above the Upper Keltner Channel on multiple occasions recently.
But, in every scenario when XHB became overbought, the ETF soon experienced a pullback.
Finding opportunities when an ETF experiences a pullback is why the Hughes Optioneering Team uses the Keltner Channels. They help us find a lower-risk entry point.
The Keltner Channel “Buy Zone” occurs when an ETF is trading below the upper Keltner Channel. Once the daily price is trading below the upper channel, it provides a lower-risk buying opportunity as the ETF is likely to rally.
Our initial price target for XHB is 85.50 per share.

107.0% Profit Potential for XHB Option
Now, since XHB is currently trading in the Keltner Channel ‘Buy Zone’, this provides us a prime entry opportunity. Let’s use the Hughes Optioneering calculator to look at the potential returns for an XHB call option purchase.
The Call Option Calculator will calculate the profit/loss potential for a call option trade based on the price change of the underlying stock/ETF at option expiration in this example from a flat XHB price to a 12.5% increase.
The Optioneering Team uses the 1% Rule to select an option strike price with a higher percentage of winning trades. In the following XHB option example, we used the 1% Rule to select the XHB option strike price but out of fairness to our paid option service subscribers we don’t list the strike price used in the profit/loss calculation.
Trade with Higher Accuracy
When you use the 1% Rule to select an XHB in-the-money option strike price, XHB only has to increase 1% for the option to breakeven and start profiting! Remember, if you purchase an at-the-money or out-of-the-money call option and the underlying ETF closes flat at option expiration it will result in a 100% loss for your option trade! In this example, if XHB is flat at 82.64 at option expiration, it will only result in a 7.8% loss for the XHB option compared to a 100% loss for an at-the-money or out-of-the-money call option.
Using the 1% Rule to select an option strike price can result in a higher percentage of winning trades compared to at-the-money or out-of-the-money call options. This higher accuracy can give you the discipline needed to become a successful option trader and can help avoid 100% losses when trading options.
The goal of this example is to demonstrate the powerful profit potential available from trading options compared to ETFs.
The prices and returns represented below were calculated based on the current ETF and option pricing for XHB on 7/21/2023 before commissions.
When you purchase a call option, there is no limit on the profit potential of the call if the underlying ETF continues to move up in price.
For this specific call option, the calculator analysis below reveals if XHB increases 5.0% at option expiration to 86.77 (circled), the call option would make 49.6% before commission.
If XHB increases 10.0% at option expiration to 90.90 (circled), the call option would make 107.0% before commission and outperform the ETF return more than 10 to 1*.
The leverage provided by call options allows you to maximize potential returns on bullish ETFs.
The Hughes Optioneering Team is here to help you identify profit opportunities just like this one.

Interested in accessing the Optioneering Calculators? Join one of Chuck’s Trading Services for unlimited access! The Optioneering Team has option calculators for six different option strategies that allow you to calculate the profit potential for an option trade before you take the trade.
Brand-New Program from Chuck!
Chuck Hughes has just launched his exciting new trading service program, Lightning Trade Alerts. This new service focuses on low-cost & short-term options trade.
Members will receive hand-picked options trades from the 10-Time Trading Champion, Chuck Hughes.
Just call Brad at 1-866-661-5664 or 1-310-647-5664 to join or CLICK HERE to schedule a call!
Wishing You the Best in Investing Success,

Chuck Hughes
Editor, Trade of the Day
Have any questions? Email us at dailytrade@chuckstod.com
*Trading incurs risk and some people lose money trading.


Recent Comments