
A few weeks ago we looked at a strategy to find trades that had a strong tailwind, increasing their likelihood of producing profit. We started with a sector that was showing promise and then looked at the individual elements of that sector to find the most beat down of those stocks. Think of it as buying the cheapest house on the most expensive block. You can read that article here.
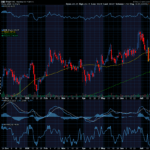
That method led us to IDRV, and ETF that focuses on electric vehicles, autonomous vehicles and the producers of components for those vehicles. Here is the chart that shows what we saw and what happened next:


The blue circle shows where we spotted an opportunity in IDRV. At the time it hadn’t confirmed a bottom yet. We pointed out that a reliable sign that it was starting its reversal was a mover over the 10 day moving average, which you can see in the top green circle. We also wanted to see confirmation of that indicator in a curve up in the MACD which played out in the lower green circle.
Using that approach would have already offered a quick 10% or more and now that IDRV has crossed it’s 50 day moving average, it is showing signs that it will continue the rally.
This simple approach of starting at a high level and zooming in to find a hot trade is a great go to when you are looking for your next trade. If you are looking for other ways to not only spot great trade but boost their potential, check out Andy Chambers’ Market Propulsion. You can get the details here.
Keep learning and trade wisely,
John Boyer
Editor
Market Wealth Daily


Recent Comments