If you aren’t using the Swiss Army knife of technical indicators, you could be leaving money on the table.
We take it for granted that we can just pull up a chart for free and add a long list of indicators to it with just a couple clicks. Imagine trying to calculate and chart them by hand? Or even program them into an early computer. The fact that they have stood the test of time shows how valuable they can be as a trading tool.
Now that they are so ubiquitous, they can sometimes act as a self fulfilling prophecy. The advances in technology have allow systematic traders to build complex automated trading strategies that often center around moving averages in one way or another. When a price crosses a commonly used moving average, it can set off a cascade of trading action due to the significant volume of automated trading.
Let’s take a look at some of the basic ways to use moving averages. First, they can be an early warning sign of a coming change.

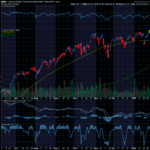
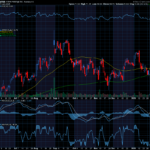
On this example the 10 day moving average is shown in green, The 50 day shown in purple and the 200 day is shown in red. We are going to focus on the 10 and 50.
The 10 day acts as an early warning sign that momentum is shifting. When the bars break through the ten day at the locations shown in green circles, you can see that the momentum changes direction. You also see there are places where the bars will bounce above and below the 10 day line. This is where the 50 day moving average can be useful. Since it is looking at a longer time frame the cross above or below the 50 can be a strong confirmation of a trend change.
If you are looking for other effective ways to spot a change in momentum, you should grab Joe Duffy’s book on momentum setups. Here is a link to grab it for free.
Keep learning and trade wisely,
John Boyer
Editor
Market Wealth Daily


Recent Comments