
Dear Reader,
Yesterday, we looked at a Daily Price Chart of Intel Corp., noting that the stock has been making a series of new 52-Week Lows recently.
For today’s Trade of the Day e-letter we will be looking at a Moving Average Convergence/ Divergence (MACD) chart for EQT Corp. stock symbol: EQT.
Before breaking down EQT’s MACD chart let’s first review what products and services the company offers.
EQT Corporation operates as a natural gas production company in the United States. The company produces natural gas, natural gas liquids, including ethane, propane, isobutane, butane, and natural gasoline. As of December 31, 2021, it had 25.0 trillion cubic feet of proved natural gas, NGLs, and crude oil reserves across approximately 2.0 million gross acres, including 1.7 million gross acres in the Marcellus play.
MACD Indicator confirms Price Momentum
The EQT daily price chart below shows that EQT is in a price uptrend as the 24/52 day MACD line (black line) is above the 18-Day EMA (purple line). The Moving Average Convergence/ Divergence chart is shown below the daily price chart.
MACD uses moving averages to create a momentum indicator by subtracting the longer-term moving average from the shorter-term moving average. The MACD is calculated by subtracting a stock’s longer term 52-Day Exponential Moving Average (EMA) from its shorter term 24-Day EMA. This creates the MACD line.
MACD ‘Buy’ Signal
The 18-Day EMA line functions as a buy/sell ‘trigger’. When the 24/52 Day MACD line crosses above the 18-Day EMA line it indicates positive momentum and higher prices for the stock. When the 24/52 Day MACD lines crosses below the 18-Day EMA it indicates negative momentum and lower prices for the stock. MACD is more of a leading indicator than a moving average cross over which tends to lag price movement.
MACD Histogram shows Acceleration of Momentum
Also included in a MACD chart is the histogram bar graph. This portion of the chart helps to illustrate the distance between the 24/52 Day MACD and the 18-Day EMA.
When a crossover initially occurs, the histogram’s bar will be near flat as the two indicator lines have converged. As the lines begin to separate, the bars grow in height, indicating a widening gap and acceleration for the stock’s momentum. When the histogram’s bars begin to shrink this indicates a narrowing of the gap between the 24/52 Day MACD and the 18-Day EMA and a slowing of the stock’s momentum. When the gap between the two indicators begins to narrow, this typically indicates a crossover of the indicator lines could happen soon.

Buy EQT Stock
As long as the 24/52 Day MACD line remains above the 18-Day EMA, the stock is more likely to keep trading at new highs in the coming days and weeks.
Since EQT’s bullish run is likely to continue, the stock should be purchased.
Our initial price target for EQT stock is 50.65 per share.

Profit if EQT Is Down 10%
Now, since EQT’s 24/52 Day MACD is trading above the 18-Day EMA and will likely rally from here, let’s use the Optioneering calculator to look at the potential returns for an EQT covered call trade. Covered calls are also known as buy writes.
The Buy Write Calculator will calculate the profit/loss potential for a covered call trade based on the price change of the underlying stock/ETF at option expiration in this example from a 10% increase to a 10% decrease in EQT stock at option expiration.
The goal of this example is to demonstrate the ‘built in’ profit potential for covered calls and the ability of covered calls to profit if the underlying stock is up, down or flat at option expiration. Out of fairness to our paid option service subscribers we don’t list the option strike price used in the profit/loss calculation.
The prices and returns represented below were calculated based on the current stock and option pricing for EQT on 8/31/2022 before commissions.
Built in Profit Potential
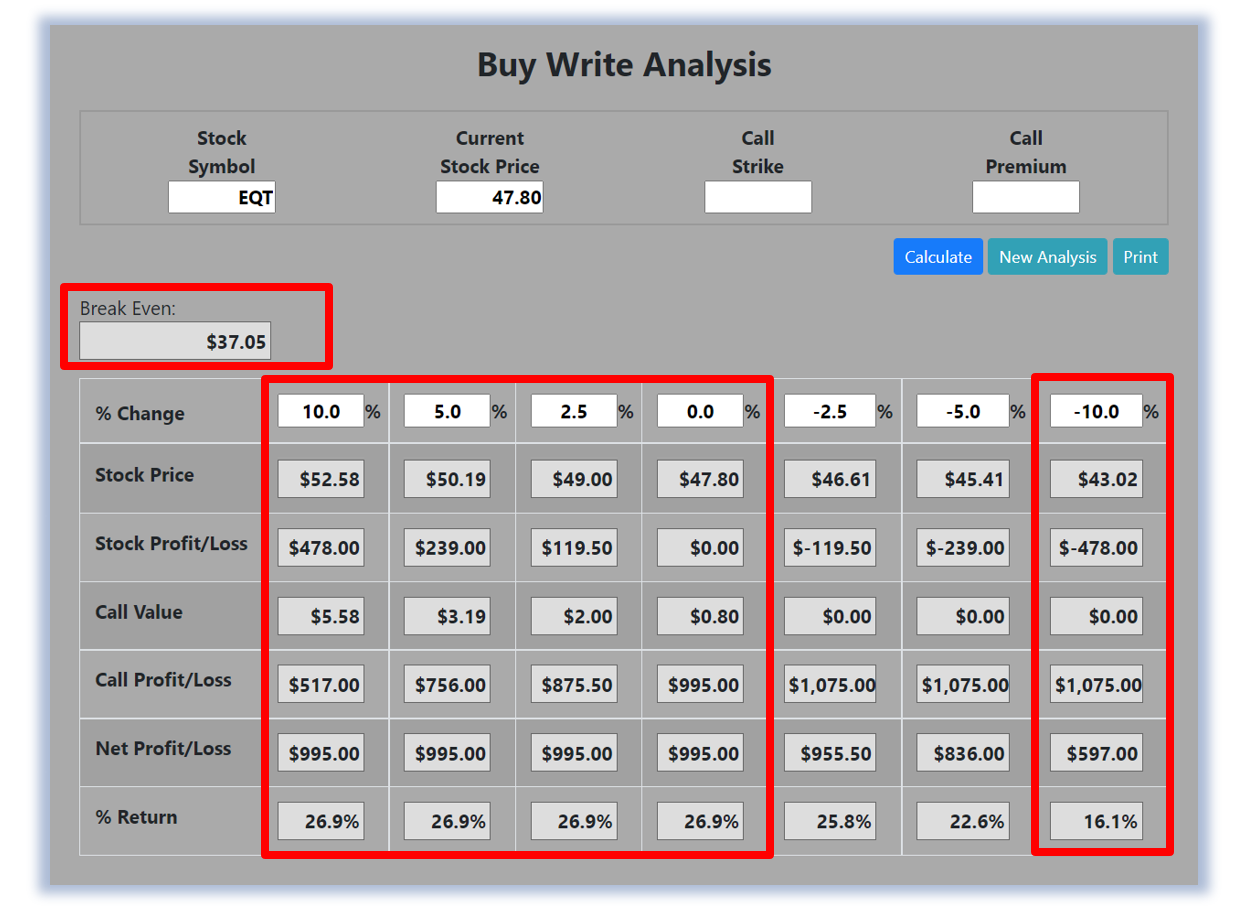
For this covered call, the calculator analysis below reveals the cost or the breakeven price is $3,705.00 (circled). The maximum risk for a covered call is the cost of the covered call.
The analysis reveals that if EQT is flat at 47.80 or up at all at expiration the covered call will realize a $995.00 profit and a 26.9% return (circled).
If EQT decreases 5.0% at option expiration, the covered call will realize an $836.00 profit and a 22.6% return.
And if EQT decreases 10.0% at option expiration, the covered call will realize a $597.00 profit and a 16.1% return.
Due to option pricing characteristics, this covered call has a ‘built in’ 26.9% profit potential when the trade was identified*.
Covered call trades can result in a higher percentage of winning trades compared to a directional stock trade if you can profit when the underlying stock/ETF is up, down or flat.
A higher percentage of winning trades can give you the discipline needed to become a successful trader.
The Optioneering Team is here to help you identify profit opportunities just like this one.
Interested in accessing the Optioneering Calculators? Join one of Chuck’s Trading Services for unlimited access! The Optioneering Team has option calculators for six different option strategies that allow you to calculate the profit potential for an option trade before you take the trade.
Average Portfolio Return of 92.2%
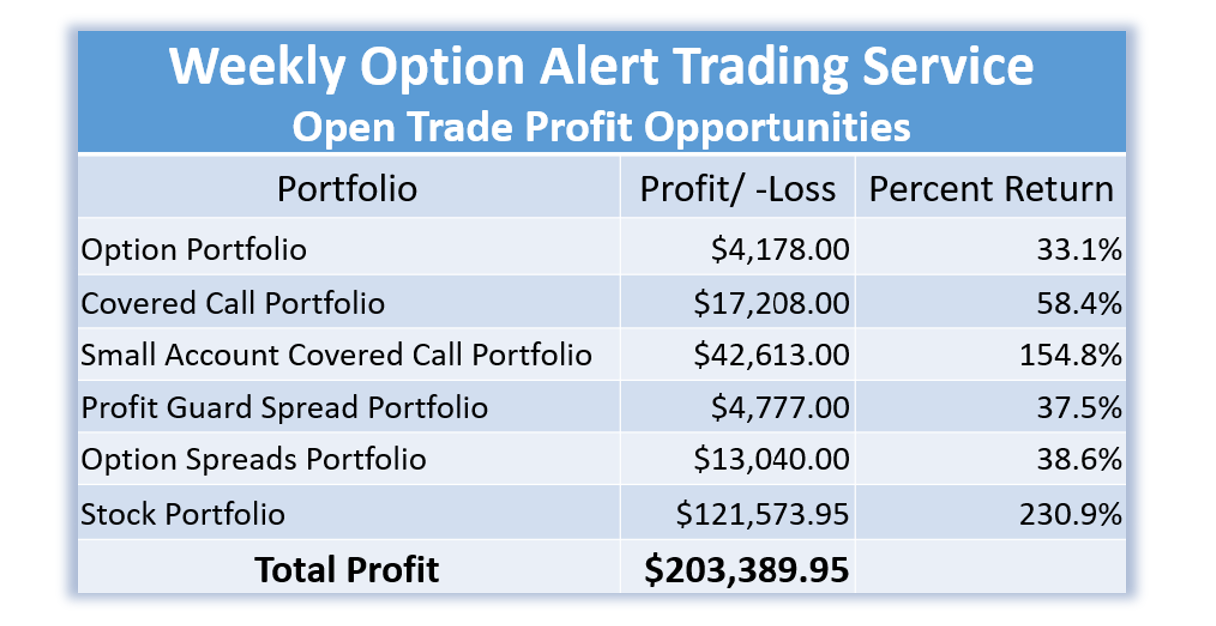
Below is a screenshot of the current open trade profit opportunities from Chuck’s Weekly Option Alert Trading Service. There are currently $203,389.95 in open trade profit opportunities with an average portfolio return of 92.2% demonstrating the ability of the Optioneering Strategy to deliver substantial returns with no losing portfolios**.
**Open trade profit results represent the open trade profit performance for the portfolio displayed on 8/31/22. Open trade profits may have increased or decreased when trades were closed out. Trading incurs risk and some people lose money trading. Past performance does not necessarily predict future results. Member profits and losses are not tracked. Profit potential is taken from results of signaled trades, not actual member results. Not all members make the trades.
Get Trade Insights Directly From Chuck
You can start getting market insights directly from 10-Time Trading Champion Chuck Hughes.
See what he’s trading and when with his exclusive Inner Circle Trading Service where he will send you his hand-picked stock and option trades.
Just call Brad at 1-866-661-5664 or 1-310-647-5664 to join or CLICK HERE to schedule a call!
Wishing You the Best in Investing Success,

Chuck Hughes
Editor, Trade of the Day
Have any questions? Email us at dailytrade@chuckstod.com
*Trading incurs risk and some people lose money trading.


Recent Comments