
January 11th, 2022
Aflac Making New 52-Week Highs
Dear Reader,
Yesterday, we looked at a Monthly Price Chart of Raymond James Financial Inc. noting the stock’s 1-Month Price is trading above the 10-Month SMA.
For today’s Trade of the Day we will be looking at a Daily Price chart for Aflac, Inc. stock symbol: AFL.
Before breaking down AFL’s daily price chart let’s first review which products and services are offered by the company.
Aflac Incorporated, through its subsidiaries, provides supplemental health and life insurance products. It operates through two segments, Aflac Japan and Aflac U.S. The Aflac Japan segment offers cancer, medical, income support, GIFT, and whole and term life insurance products, as well as WAYS and child endowment plans under saving type insurance products in Japan. The Aflac U.S. segment provides cancer, accident, short-term disability, critical care, hospital indemnity, dental, vision, long-term care and disability, and term and whole life insurance products in the United States.
Now, let’s begin to break down the Daily Price chart for AFL. Below is a Daily Price Chart with the price line displayed by an OHLC bar.
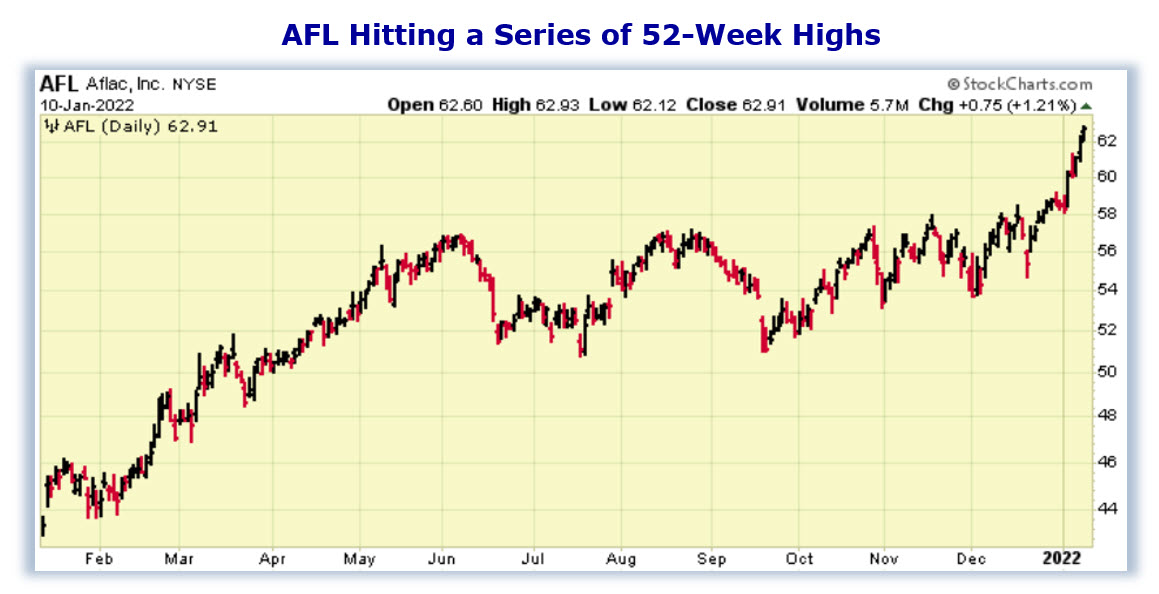
Buy AFL Stock
The Daily Price chart above shows that AFL stock has been hitting new 52-Week Highs regularly since early January.
Simply put, a stock does not just continually hit a series of new 52-Week Highs unless it is in a very strong bullish trend.
The Hughes Optioneering team looks for stocks that are making a series of 52-Week Highs as this is a good indicator that the stock is in a powerful uptrend.
You see, after a stock makes a series of two or more 52-Week Highs, the stock typically continues its price uptrend and should be purchased.
Our initial price target for AFL stock is 68.00 per share.
73.2% Profit Potential for AFL Option
Now, since AFL stock has recently been hitting 52-Week Highs and will likely rally from here, let’s use the Hughes Optioneering calculator to look at the potential returns for an AFL call option purchase.
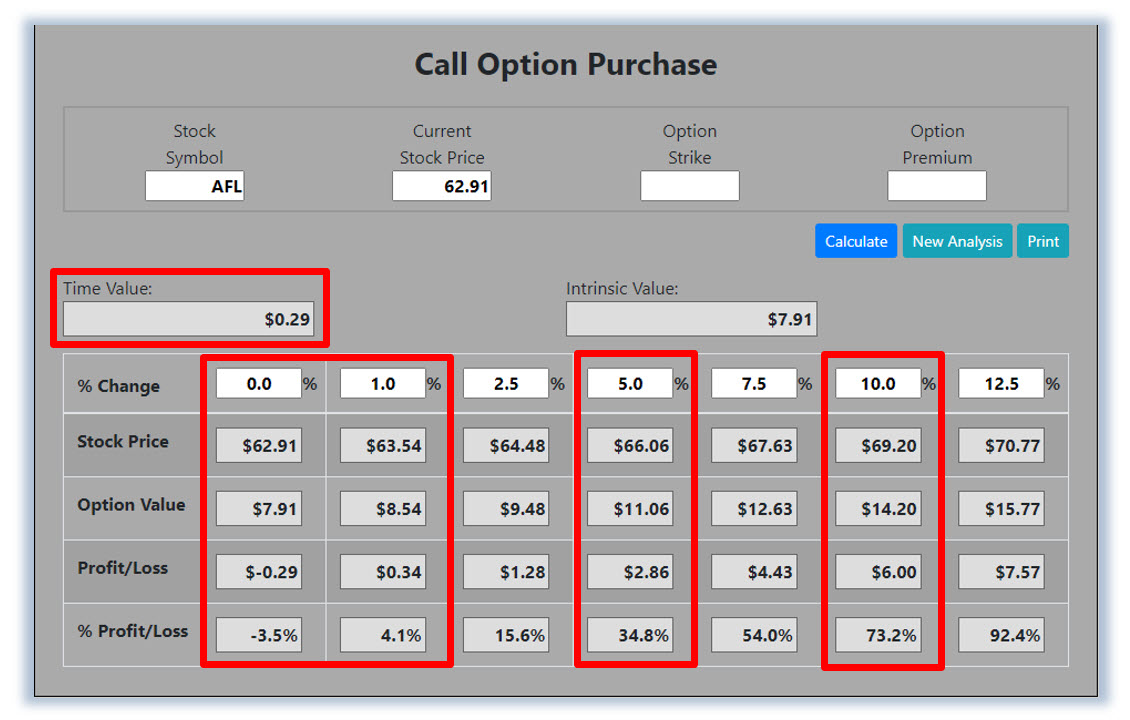
The Call Option Calculator will calculate the profit/loss potential for a call option trade based on the price change of the underlying stock/ETF at option expiration in this example from a flat AFL price to a 12.5% increase.
The Optioneering Team uses the 1% Rule to select an option strike price with a higher percentage of winning trades. In the following AFL option example, we used the 1% Rule to select the AFL option strike price but out of fairness to our paid option service subscribers we don’t list the strike price used in the profit/loss calculation.
Trade with Higher Accuracy
When you use the 1% Rule to select a AFL in-the-money option strike price, AFL stock only has to increase 1% for the option to breakeven and start profiting! Remember, if you purchase an at-the-money or out-of-the-money call option and the underlying stock closes flat at option expiration it will result in a 100% loss for your option trade! In this example, if AFL stock is flat at 62.91 at option expiration, it will only result in a 3.5% loss for the AFL option compared to a 100% loss for an at-the-money or out-of-the-money call option.
Using the 1% Rule to select an option strike price can result in a higher percentage of winning trades compared to at-the-money or out-of-the-money call options. This higher accuracy can give you the discipline needed to become a successful option trader and can help avoid 100% losses when trading options.
The goal of this example is to demonstrate the powerful profit potential available from trading options compared to stocks.
The prices and returns represented above were calculated based on the current stock and option pricing for AFL on 1/10/2022 before commissions.
For this specific call option, the calculator analysis below reveals if AFL stock increases 5.0% at option expiration to 66.06 (circled), the call option would make 34.8% before commission.
And if AFL stock increases 10.0% at option expiration to 69.20 (circled), the call option would make 73.2% before commission and outperform the stock return more than 7 to 1.
The leverage provided by call options allows you to maximize potential returns on bullish stocks.
The Hughes Optioneering Team is here to help you identify winning trades just like this one.
Interested in accessing the Optioneering Calculators? Join one of Chuck’s Trading Services for unlimited access! The Optioneering Team has option calculators for six different option strategies that allow you to calculate the profit potential for an option trade before you take the trade.
Start Getting Trades from the Champion
Do you want to start receiving hand-picked trades from 10-Time Trading Champion, Chuck Hughes?
As a Trade of the Day subscriber, Chuck is offering you a special discount on his Weekly Option Alert Trading Service.
Just call Brad at 1-866-661-5664 or 1-310-647-5664 to join and use the code “Optioneering VIP” to receive special pricing!
Wishing You the Best in Investing Success,
Chuck Hughes
Editor, Trade of the Day
Have any questions? Email us at dailytrade@chuckstod.com
© 2021 Tradewins Publishing. All rights reserved. | Privacy Policy | Terms and Conditions | Contact Us
If you didn’t create an account using this email address, please ignore this email or unsubscribe.
To ensure delivery of this email to your inbox and to enable images to load in future mailings, please add todaystrade@chuckstod.com to your e-mail address book or safe senders list.
© 2021 Tradewins Publishing. All rights reserved. The information provided by the newsletters, trading, training and educational products related to various markets (collectively referred to as the “Services”) is not customized or personalized to any particular risk profile or tolerance. Nor is the information published by Legacy Publishing, LLC (“Legacy”) a customized or personalized recommendation to buy, sell, hold, or invest in particular financial products. Past performance is not necessarily indicative of future results. Trading and investing involve substantial risk and is not appropriate for everyone. The actual profit results presented here may vary with the actual profit results presented in other Legacy Publishing LLC publications due to the different strategies and time frames presented in other publications. Trading on margin carries a high level of risk and may not be suitable for all investors. Other than the refund policy detailed elsewhere, Legacy does not make any guarantee or other promise as to any results that may be obtained from using the Services. Legacy disclaims any and all liability for any investment or trading loss sustained by a subscriber. You should trade or invest only ‘risk capital’ – money you can afford to lose. Trading stocks and stock options involves high risk and you can lose the entire principal amount invested or more. There is no guarantee that systems, indicators, or trading signals will result in profits or that they will not produce losses. Some profit examples are based on hypothetical or simulated trading. This means the trades are not actual trades and instead are hypothetical trades based on real market prices at the time the recommendation is disseminated. No actual money is invested, nor are any trades executed. Hypothetical or simulated performance is not necessarily indicative of future results. Hypothetical performance results have many inherent limitations, some of which are described below. Also, the hypothetical results do not include the costs of subscriptions, commissions, or other fees. Because the trades underlying these examples have not actually been executed, the results may understate or overstate the impact of certain market factors, such as lack of liquidity. Legacy makes no representations or warranties that any account will or is likely to achieve profits similar to those shown. No representation is being made that you will achieve profits or the same results as any person providing a testimonial. No representation is being made that any person providing a testimonial is likely to continue to experience profitable trading after the date on which the testimonial was provided, and in fact the person providing the testimonial may have subsequently experienced losses. The cost basis for some of the options in a portfolio may be reduced by rolling over profits at option expiration which is one of the Hughes Optioneering Trade Management Rules. Some income figures presented represent the total amount of option premium collected during the referenced period. Actual profits were less. Open trade profit results may have increased or decreased when the trades were closed out. Chuck Hughes’ experiences are not typical. Chuck Hughes is an experienced investor and your results will vary depending on risk tolerance, amount of risk capital utilized, size of trading position, willingness to follow the rules and other factors.


Recent Comments