
Wednesday, September 22nd, 2021
Happy Wonderful Wednesday!
Last week, the market gave us three down days which result in a flat week. Price created a straight line. Today, Monday, had a huge drop. It seems as if a major correction may have started. Of course, it will take more than one down day to know for sure. We will continue to watch how the week plays out.
To review past equity candidates, scroll down.
For today’s Trade of the Day, we will be looking at Apple, Inc., symbol (AAPL). Before analyzing AAPL’s chart, let’s take a closer look at the stock and its services.
Apple Inc. designs, manufactures, and markets smartphones, personal computers, tablets, wearables, and accessories worldwide. It also sells various related services. The company offers iPhone, a line of smartphones; Mac, a line of personal computers; iPad, a line of multi-purpose tablets; and wearables, home, and accessories comprising AirPods, Apple TV, Apple Watch, Beats products, HomePod, iPod touch.
Apple Inc. was founded in 1977 and is headquartered in Cupertino, California.
I looked through a lot of charts over the weekend. I zeroed in on AAPL on Monday because it looks ready to head lower. It is a widely traded stock with lots of volume.
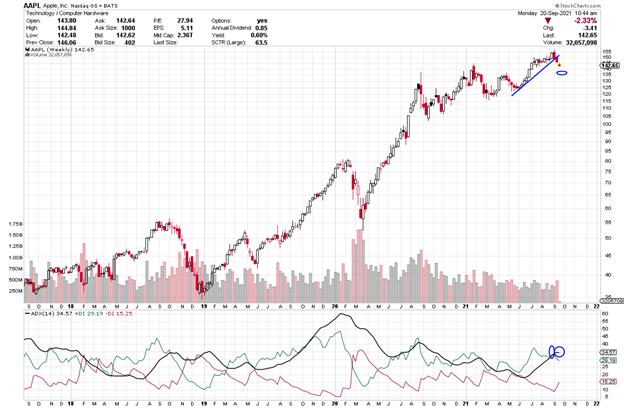

On the ADX indicator below the chart, notice how the green +DI line is heading down after crossing below the black ADX line. The red -DI line is heading up. These are all signals of building bearish strength with the thought that price may continue to drop.
For those who want more info on ADX, I give more details in the section below, or scroll down to the trade info.
Average Directional Index (ADX) Points to Direction and Strength
ADX is an easy indicator to interpret. The +DI line (green) is bullish and when it is on top, it suggests price is going to head up. When the -DI line (red) is on top, it suggests price is going to drop.
The black line is the strength line and when it heads up, it is telling you strength is moving into the DI line that is on top and in control. When the ADX line has been heading down, the DI line on top has been weakening and is ready for a change.
When the DI lines swap places and cross up and the ADX heads up, it suggests strength is moving into the new DI direction.
ADX signal = Profit Payout
Each candle on the chart represents price movement of a week. As the + DI heads down and moves below the black line and both drop toward the red line, it suggests there is bearish strength that could continue to grow, especially once the black line starts to turn up. If price continues to move down, the ADX line (black) will continue to turn to head up to imply that strength will continue to support the trade. As long as the ADX is heading up, it means it is supporting the bearish- up direction. The opposite is true if the +DI line heads up to cross the -DI line – this suggests bullish strength and a rise in price. If the ADX line heads up while the green +DI is on top, is it saying strength is building into the upward direction.
I am looking at its chart and possible trade on Monday, but the pattern looks as if it will continue and the -DI may take over if price keeps dropping. You don’t want to consider entry if the current candle doesn’t move below 143 or if the +DI line were to turn back up.
If you are interested in learning more about the ADX strength line, I’d like to suggest you consider getting Inevitable Trend Moves. This book covers in detail how to trade the ADX to jump in during a confirmed strength stage that is as clear as looking at a picture with arrows pointing out direction.
AAPL Potential Trade
Please note and remember that I am typing this on Monday, two days before you receive it and the information, I am sharing could change over those two days and is intended to share the opportunities that options offer us.
Apple (AAPL) last week was down and this week it continues a downward move, suggesting it may breakdown for a correction and larger drop. It appears to be ready to head lower and have the ADX flatten out, and then turn up to rise, if this continues, the pattern should remain intact as price keeps dropping. Notice the – DI is heading up and is below the +DI line on the chart above. We want the -DI to cross rising above the +DI (red line above green) to consider a trade.
Price is likely to drop further and move below 143 entry. Its first target is 136 as the -DI (red line) moves up and the ADX (black line) eventually turns up. Its current downtrend should remain intact, and price should continue to drop, perhaps even as low as 137. We will keep an eye on AAPL over the next couple weeks.
I am looking at charts on Monday, so prices are apt to change a little by Wednesday. Be sure the green +DI line continues to drop and goes below the red -DI line and price below the 143 before entry.
The short-term price target for AAPL is $137, and then perhaps lower.
To buy shares AAPL today, price would be approximately 143. It would be silly to buy shares if you expect price to drop. You’d wait until it hit a bottom and started to rise again.
This said, option trading offers the potential of a smaller initial investment and higher percentage gain even when price is expected to rise. Let’s take a look.
If you bought one Put option contract covering 100 shares of AAPL’s stock with an Oct 8th expiration date (Oct wk 2) for the $137 strike and premium would be approximately $1.47 today or a total of $147 per contract. If price decreased the expected $7 to $137 target over the next few weeks, the premium might increase approximately $4 to $5.47 per share or $400 on your 100-share contract. This is a gain of $400 on your $147 investment or a 272% gain over a few weeks.
Remember you can close an option trade anywhere along the line before expiration to take gains or stop a loss.
The example of making money when price drops rather than holding losing shares of stock. Big difference.
Options can offer a win, win, win trade opportunity. They often offer a smaller overall investment, covering more shares of stock and potentially offer greater profits.
If you are having any kind of trouble taking advantage of these trades, I don’t want you to miss out. I have put together programs that help traders just like you access the potential profits that options provide. I write like we are having a conversation, so the information is easy to understand and apply. Be sure to check out the programs shared in this email and we will make it easy for you to get your share.
I love to trade, and I love to teach. It is my thing.
Yours for a prosperous future,
Wendy Kirkland
PS-I have created this daily letter to help you see the great potential you can realize by trading options. Being able to recognize these set ups are a key first step in generating wealth with options. Once you are in a trade, there is a huge range of tools that can be used to manage the many possibilities that can present themselves. If you are interested in learning how to apply these tools and increase the potential of each trade, click here to learn more.

Review of Past Candidates:
Last week, we discussed COP and a Oct 1st (Oct wk 1) expiration, a 60 strike and a premium of .75. Premium went as high as 1.38 on the 16th and by Friday settled back to an ask of 1.14 or near 84% at its highest last week.
To check out this and other past trades go to https://www.tradewinsdaily.com/category/daily-profit-play/


Recent Comments