
From Keith Harwood of OptionHotline…
Where is support in this freefalling market?
To help guide one’s trading plan, it’s important to determine the level that, if breached, nullifies the trade thesis. For me, I am still bullish on the overall markets, but there are levels that are approaching that could prove to be problematic if they fail to hold.
Let’s walk through those levels for my main three indexes: the S&P 500, NASDAQ 100, and Russell 2000.
First, in the S&P 500, we see the following chart:
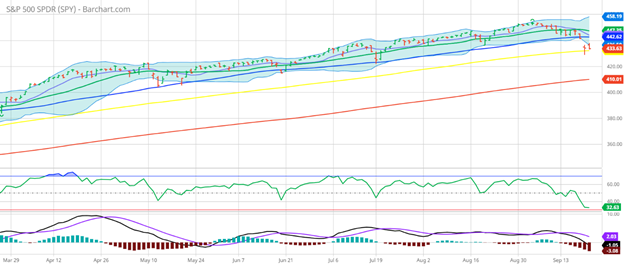

The 100-Day Moving Average is trying to prove that it is support. We will see if it can hold in the coming days.
Second, in the NASDAQ 100, we see the following:
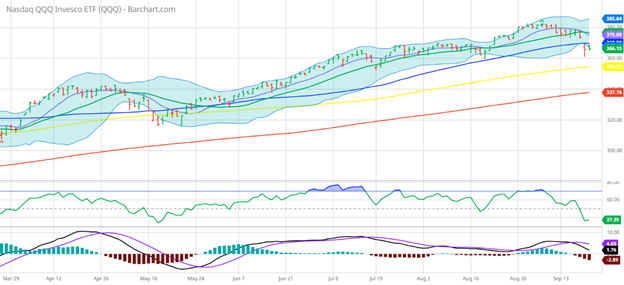
The August 19th low of $359.96 seems to be a big level, and we are very close to it now. If that can hold, tech can be very bullish in the near term.
Finally, in the Russell 2000, we see support at the following level:
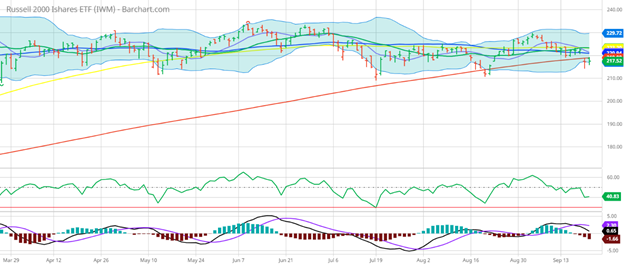
The July 19th low of $209.05 would be a crucial level that cannot be breached without giving a bearish tone to small caps.
Given all of this, I am looking for long entries once some other technical levels are set. For now, they’re not confirmed, but they are getting close. Today, tomorrow, or maybe next week we will see those support levels breached, telling me that it’s time to be bearish. Or we will see them hold, confirming my bullish thesis and preparing me for further long positioning. Time will tell.
Please also take this chance to review how I apply technical signals to my options trades at https://optionhotline.com and if you have any questions, never hesitate to reach out.
Keith Harwood
Keith@optionhotline.com
PS-To see more of my articles on Market Wealth Daily, click here


Recent Comments