
Thursday, September 23rd, 2021
Happy Thriving Thursday!
Last week, the market was down 4 days out of 5 trading days. This week the S&P had a major drop on Monday and up modestly on Tuesday as I type. There have been lots of daily swings, but the S&P looks tired as if it needs to pullback a little to rest that certainly happened on Monday.
Am going to call Thursday “SPY Day”. Each Thursday, I will focus on what SPY is doing, with the hope it will help give us a clue about the market’s upcoming moves.
For more ideas on trading SPY, click here.
SPY or the SPDR S&P 500 trust is an exchange-traded fund which trades on the NYSE Arca under the symbol SPY. SPDR is an acronym for the Standard & Poor’s Depositary Receipts, the former name of the ETF. It is designed to track the S&P 500 stock market index. This fund is the largest ETF in the world and gives a good overall picture of the market. SPY includes shares from the top 500 companies.
The chart of the S&P below is a weekly chart with a TSI indicator at the bottom. The description coming up next explains how to use the TSI.
True Strength Indicator
The True Strength Index (TSI) is an oscillator that fluctuates between positive and negative territory. As with many momentum oscillators, the centerline defines the overall bias. The bulls have the momentum edge when TSI is positive, and the bears have the edge when it’s negative. As with MACD, a signal line can be applied to identify upturns and downturns. Signal line crossovers are, however, quite frequent and require further filtering with other techniques. Chartists can also look for bullish and bearish divergences to anticipate trend reversals; however, keep in mind that divergences can be misleading in a strong trend.
TSI is somewhat unique because it tracks the underlying price quite well. In other words, the oscillator can capture a sustained move in one direction or the other. The peaks and troughs in the oscillator often match the peaks and troughs in price. In this regard, chartists can draw trend lines and mark support/resistance levels using TSI. Line breaks as well as line crosses can then be used to generate signals.
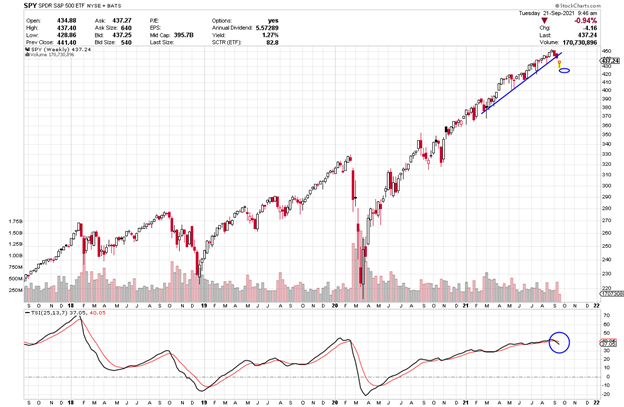

Plain and Simple
On the line indicator at the bottom of the chart, look how the black line dipped down and now appears to be crossing down below the red line. The numbers to the left show that it has actually crossed down. It could continue down. The candles furthest to the right are the most recent weeks’ candles. This week’s candle is still red as I type though it has improved from Monday’s large drop as I type on Tuesday. A hollow red candle means it is higher than yesterday’s close but still bearish. It will be interesting to see how the week ends. TSI suggests there is still more of a correction ahead and today’s bullishness may be just a little rest, recovery after such a big drop. Letting off a little steam.
Even though this week, the SPY appears as if it is deciding what to do from here, the chart suggests a drop.
TSI Buy Signal
Each candle on the chart represents price movement over one day. For months, the SPY has broken out and has been moving up. The TSI line has dug into its signal line and by the numbers has now dropped below so we are going to discuss another Put trade.
It needs to push downward further and move further below the TSI line and drop in price. If it were to break through this level, price would then drop and perhaps, take the market into a correction.
Below I will discuss how things can be traded if the SPY continues to down.
Check out the profit potential of option trading versus buying stock. Big difference!!!
SPY is a well-rounded ETF, offering exposure to the price moves of 500 equities. Options Trade Both Directions (depending on what happens)
To buy shares of SPY today would cost approximately $435 per share (as I write this on Tuesday), but I am suggesting that it may drop more. It has swung back and forth. Make sure it drops below 435 before considering a Put trade which profits from a fall in price.
Option trading offers the potential of a lower initial investment and higher percentage gain. Let’s take a look and compare.
You can buy call options if you expect price to go up and put options if you feel price is going to drop.
If you bought 2 shares of SPY at $435, you would invest a total of $870. Now if SPY were to remain above $435 and say, moves higher to 440 again, it would profit $5 per share or $10 for the two shares or 1.1%. Not a very exciting profit.
If it drops through support at $435 to 425, you lose $10 per share or $20 for the two shares if it stopped at that level or even more if it kept dropping.
Now to compare. If you bought one Put option contract covering 100 shares of stock with an Oct 4th (Oct wk 1) expiration date for the $425 strike (if price drops), the premium would be approximately $3.95 per share or $395 for the contract. If price decreased the expected $10 over the next few weeks, the option premium would increase approximately $7 to $10.95. This is a gain of $7 per share or $700 for the 100-share contract or 177% over a short period of time.
If price doesn’t drop below 435, don’t consider a Put trade.
Option trading is truly unique in its ability to give traders the opportunity to trade an equity’s price move in either direction.
These types of trades are what can bring life-changing financial gains.
I want to stress, when you trade options, you can close the trade anywhere along the line to take profit (or loss). You don’t have to wait until it hits the target or until expiration day.
You also want to wait for the indicator confirmation and don’t jump-the-gun with an early entry.
Trading options can be a win, win, win opportunity. Options often offer a smaller overall investment, covering more shares of stock and potential for greater profits.
What’s Next? I Can Hardly Wait!
Keep an eye on your inbox and I will keep sharing what I have my eye on. If you want to get deeper into how I find these winners, be sure to check out the programs in the banners in this message to learn more about options.
I love teaching and write my strategy books as clear as I write these emails. I try to think of the questions you’ll ask before you ask them. Sign up and join me in the profit potential.
Yours for a Prosperous Future,
Wendy Kirkland

Past week’s trades:
Last week, we discussed a Put trade with an Oct 1st (Oct Wk1) expiration for the 440 strike and a premium of $4.31. With the huge drop on Monday, the premium went up to 13.00 per share or a gain of 8.69 or 202% gain in a few days. Today as I type, premium is still at 9.80 which is more than double or 100%+. Awesome trade and example of how to make money when the price of an equity drops. to read the article, click here.


Recent Comments