
Happy Thankful Tuesday!
I am excited to share that you don’t need special education or to sit in front of the computer all day to trade options. It can be easily learned if you are interested in spending an hour or so a week earning money in what could be considered “renting” stocks for a short period of time.
This is why I show you the details about an equity’s symbol and pattern each week. I spotted a trade with the potential for 588% gains in a short period of time. I have outlined it below so be sure to keep reading.
I am typing this on Sunday. The Nasdaq was down 3 out of 4 days.
For the updates on previously discussed symbols, please scroll down.
For today’s Trade of the Day, we will be looking at Apple Inc. (AAPL).
Before analyzing AAPL’s chart, let’s take a closer look at the company and its services.
Apple Inc. designs, manufactures, and markets smartphones, personal computers, tablets, wearables, and accessories worldwide. It also sells various related services. In addition, the company offers iPhone, a line of smartphones; Mac, a line of personal computers; iPad, a line of multi-purpose tablets; AirPods Max, an over-ear wireless headphone; and wearables, home, and accessories comprising AirPods, Apple TV, Apple Watch, Beats products, HomePod, and iPod touch. The company also sells its products through its retail and online stores, and direct sales force; and third-party cellular network carriers, wholesalers, retailers, and resellers. Apple Inc. was incorporated in 1977 and is headquartered in Cupertino, California.
Each candle on the chart represents price movement over a 5-day (week) period. The indicator at the bottom of the chart is a Channel Commodity Index (CCI).
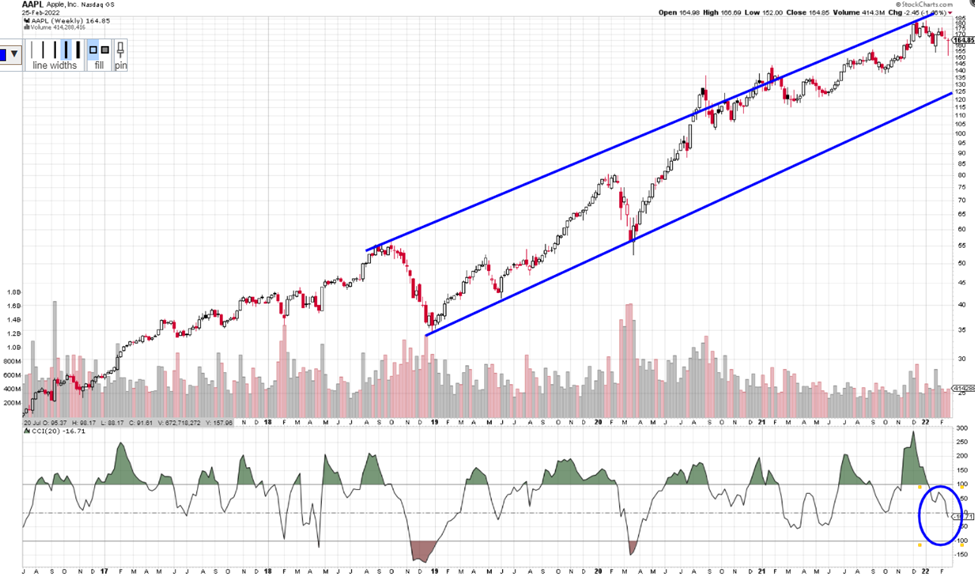
A cross up through the CCI zero or 100 line is bullish, in that it is suggesting price has gone from bullish to even more bullish. A cross up through the zero line and a cross through -100, suggests price is bearish. If you want to learn more about the CCI, you can read through the short section below or you can scroll down to the alert signal.
Channel Commodity Index
A move down to the CCI -100 or the zero line can issue a Put entry signal as it moves from being bullish to bearish. A move toward -100 is a continuation of that bearishness. Up through the 100 line creates a green fin of bullishness, until it drops back down through the -100 line.
A break below the zero line means it has gone from bullish to bearish and a drop below -100 suggests even more bearishness.
The Commodity Channel Index (CCI) is a versatile indicator that can be used to identify a new trend or warn of extreme conditions. Originally, it was developed to identify cyclical turns in commodities, but the indicator can be successfully applied to indices, ETFs, stocks and other securities. In general, CCI measures the current price level relative to an average price level over a given period. CCI is relatively high when prices are far above their average but is relatively low when prices are far below their average. In this manner, CCI can be used to identify overbought and oversold levels or breaks from one level to another.
Check Out How This Trade Could Pay Out Big Time
AAPL’s is bearish as it falls to the 0 and possibly further near the -100 line. This week’s candle is apt to continue its downward movement. We are looking for a continued move below $163 before considering entry. The short term target is $150 and then higher.
Potential Profit Play for AAPL
If AAPL’s price continues to move down, you could consider a Put trade. I am writing this on Sunday, if price continues to move to $163 when you receive this on Tuesday, you could consider a put option trade. We are expecting the CCI indicator to continue moving to the -100 line.
These examples are listed as an example to show how options work and the advantages they offer.
To buy shares of Apple Inc. (AAPL) stock today, it would cost approximately $165 per share. You would wait until Apple hit a bottom before buying Apple stock.
Option trading offers the potential of a lower initial investment and higher percentage gain. It is like renting stock versus buying out right. Let’s take a look.
If you bought one Put option contract covering 100 shares of AAPL’s stock with a March 18th (Mar22) expiration date for the 150 strike, the premium would be approximately $1.02 per share or a total of $102 for the contract of 100 shares. If price fell the expected $13 over the next few weeks, the premium would likely increase approximately $6.00 to $7.02 This is a gain of 588% profit. That would be a nice trade over a short period of time!
It is exciting to make money if price rises or falls.
I want to remind you that you can sell to close and take profit any time along the line before the expiration date. You don’t have to hold the contract until expiration.
Options often offer a smaller overall investment, covering more shares of stock and potential for greater profits. This is like renting stocks versus having to pay full price to buy.
This said, if you are having any kind of trouble taking advantage of these trades, we don’t want you to miss out. I have put together programs that help traders just like you access the potential profits that options provide. Be sure to check out the programs shared in this email and we will make it easy for you to get your share.
I love to trade, and I love to teach. It is my thing.
Yours for a prosperous future,
Wendy Kirkland
PS-I have created this daily letter to help you see the great potential you can realize by trading options. Being able to recognize these set ups are a key first step in generating wealth with options. Once you are in a trade, there is a huge range of tools that can be used to manage the many possibilities that can present themselves. If you are interested in learning how to apply these tools and increase the potential of each trade, click here to learn more.

Previous Trade Candidates:
Last week we discussed buying the ABNB March 18th 185 Call Strike. The stock price never got to our entry point so no trade would have been taken.
Two weeks ago we discussed buying BIDU 180 March 18th Calls. If you bought on Feb 15th the premium was $4.45. The premium did not move much throughout the week. We will continue to monitor this trade.
Three weeks ago we discussed buying JD March 18th 75 Calls. Premium on 2/8 was $5.60. You could have sold on 2/10 for $8.85 or a 58% profit. Last week the premium has fallen. Since there is more time left before expiration, we will continue to watch this trade.


Recent Comments