Happy Wonderful Wednesday!
Last week the Dow was up 3 days out of 4. The market is nearing highs. It has a little room to move up then may hit previous resistance and pull back.
To review past equity candidates, scroll down.
For today’s Trade of the Day, we will be looking at Gilead Sciences Inc., symbol (GILD). Before analyzing GILD’s chart, let’s take a closer look at the stock and its services.
Gilead Sciences, Inc., a research-based biopharmaceutical company, discovers, develops, and commercializes medicines in the areas of unmet medical need in the United States, Europe, and internationally. The company provides Biktarvy, Genvoya, Descovy, Odefsey, Truvada, Complera/ Eviplera, Stribild, and Atripla products for the treatment of human immunodeficiency virus (HIV) infection; Veklury, an injection for intravenous use, for the treatment of coronavirus disease 2019; and Epclusa, Harvoni, Vosevi, Vemlidy, and Viread for the treatment of liver diseases. It also offers Yescarta, Tecartus, Trodelvy, and Zydelig products for the treatment of hematology, oncology, and cell therapy patients. In addition, the company provides Letairis, an oral formulation for the treatment of pulmonary arterial hypertension; Ranexa, an oral formulation for the treatment of chronic angina; and AmBisome, a liposomal formulation for the treatment of serious invasive fungal infections. The company was founded in 1987 and is headquartered in Foster City, California.
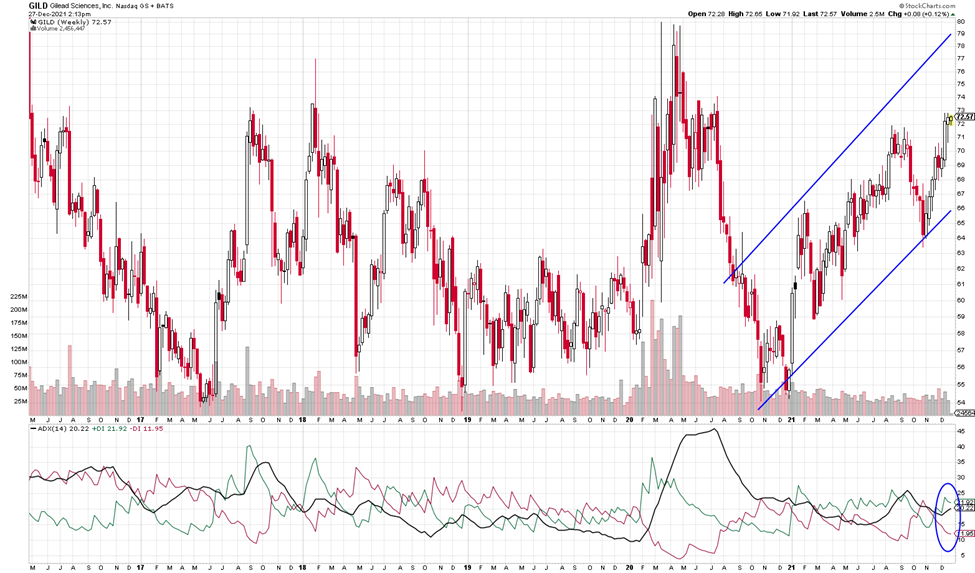
On the ADX indicator below the chart, notice how the green +DI line is on top of the -DI line (red) and the ADX. The green +DI line is above and the ADX line has turned up. These are all signals of building bullish strength with the thought that price may continue to rise.
The candles have headed up for weeks.
For those who want more info on ADX, I give more details in the section below, or scroll down to the trade info.
Average Directional Index (ADX) Points to Direction and Strength
ADX is an easy indicator to interpret. The +DI line (green) is bullish and when it is on top, it suggests price is going to head up. When the -DI line (red) is on top, it suggests price is going to drop.
The black line is the strength line and when it heads up, it is telling you strength is moving into the DI line that is on top and in control. When the ADX line has been heading down, the DI line on top has been weakening and is ready for a change.
When the DI lines swap places and cross up and the ADX heads up, it suggests strength is moving into the new DI direction.
ADX signal = Profit Payout
Each candle on the chart represents price movement of a week. As the +DI heads up and moves further above the black line and both rise above the red line, it suggests there is bullish strength that could continue to grow, especially once the black line starts to turn up. If price continues to rise, the ADX line (black) will continue to turn to head up to imply that strength will continue to support the trade. As long as the ADX is heading up, it means it is supporting the bullish- up direction. The opposite is true if the -DI line heads up to cross the +DI line – this suggests bearish strength and a climb in price. If the ADX line heads up while the red line -DI is on top, is it saying strength is building into the downward direction.
I am looking at its chart and possible trade on Monday, but the pattern looks as if it has gotten started will continue and the +DI may continue heading up if price keeps rising. You don’t want to consider entry if the current candle doesn’t stay above 72 or if the +DI line were to turn down and drop below the ADX.
GILD Potential Trade
Please note and remember that I am typing this on Monday, two days before you receive it and the information, I am sharing could change over those two days and is intended to share the opportunities that options offer us.
Gilead Sciences (GILD) has been heading up for several weeks, suggesting it is strong. It has turned up with strength. It appears to be ready to head higher and the +DI had crossed up, if this continues, the pattern should remain intact as price keeps rising. Notice the +DI is above the -DI line on the chart above. We want the +DI to stay above the -DI (green line above red) to consider a trade. Then we’ll hope the ADX continues its upward strength.
Price is likely to rise further and move above 72 entry. Its first target is 76 as the +DI (green line) stays above and the ADX (black line) continues to head up. Its current uptrend should remain intact, and price should continue to rise, perhaps even higher. We will keep an eye on GILD over the next couple weeks.
I am looking at charts on Monday, so prices are apt to change a little by Wednesday. Be sure the green +DI line continues to rise and goes further above the red -DI line and price stays above 72 before entry.
To buy shares GILD today, price would be approximately 72. It would be silly to buy shares if you expect price to drop. You’d wait until it hit a bottom and started to rise again. If price stays above 72, perhaps you could buy 10 shares for $720. If price rose to $76, that would be a profit of $4 or $40 for the 10 shares or a .05% gain.
This said, option trading offers the potential of a smaller initial investment and higher percentage gain even when price is expected to rise. Let’s take a look.
If you bought one Call option contract covering 100 shares of GILD’s stock with a January 21st expiration date (Jan22) for the $76 strike and premium would be approximately $.42 today or a total of $42 per contract. If price increased the expected $4 to $76 target over the next few weeks, the premium might increase approximately $2 to $ 2.42 per share or $242 on your 100-share contract. This is a gain of $242 on your $42 investment or a 576% gain over a couple weeks.
Remember you can close an option trade anywhere along the line before expiration to take gains or stop a loss.
Options can offer a win, win, win trade opportunity. They often offer a smaller overall investment, covering more shares of stock and potentially offer greater profits.
If you are having any kind of trouble taking advantage of these trades, I don’t want you to miss out. I have put together programs that help traders just like you access the potential profits that options provide. I write like we are having a conversation, so the information is easy to understand and apply. Be sure to check out the programs shared in this email and we will make it easy for you to get your share.
I love to trade, and I love to teach. It is my thing.
Yours for a prosperous future,
Wendy Kirkland
PS-I have created this daily letter to help you see the great potential you can realize by trading options. Being able to recognize these set ups are a key first step in generating wealth with options. Once you are in a trade, there is a huge range of tools that can be used to manage the many possibilities that can present themselves. If you are interested in learning how to apply these tools and increase the potential of each trade, click here to learn more.

Review of Past Candidates:
Last week we discussed, UVXY with an expiration date of January 14 (Jan wk2) for a strike of 25 and a premium of 2.93. On Thursday, premium dropped to .50. On Friday, it fell further.


Dear Wendy,
I am very interested in investing in the Bio tech companies researching the age process to increase life times.
Please advise how I could get started dong this.