
The VIX predicted downside.
As we noted on April 25, “Keep an eye on the Volatility Index (VIX). At the moment, it’s too calm under 17. Historically, when it’s this eerily calm and relative strength (RSI), Bollinger Bands, Full Stochastics, and Williams’ %R are this low, we’ll see an increase in volatility, and chaos in the markets. “
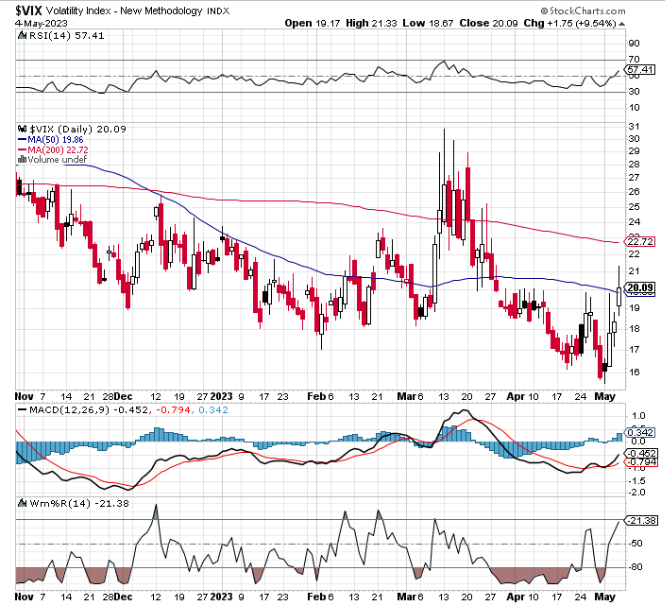

“In fact, if you look at a two-year chart of the VIX with those very technical indicators, you can see just how calm it is – and how we can historically use that calm to our advantage. For one, when the VIX challenges or penetrates its lower Bollinger Band, it’s considered oversold, and begins to pivot higher shortly after. That increase in volatility often leads to downside in the major indices. Two, we can confirm the VIX is oversold with RSI at or below its 30 line. Three, we can confirm its oversold again with Full Stochastics at or near its 20-line. And four, we can confirm further with W%R at or above its 80-line.”
Shortly after highlighting what the VIX was telling us, chaos ensued.
Not only did the VIX soar to about 20, as of today, but the Dow Jones sank from about 34,250 to 33,023. While we could easily see further downside, fear is getting a bit out of hand. With the VIX now pushing too high, too fast, it could soon reverse, and give way to upside in the overall markets.
Sincerely,
Ian Cooper


Recent Comments