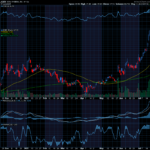
The attached chart is a close up of Tuesday trading in the SP 500. It is a 2 minute chart of the closes, which I used to take out the noise so you can see the pattern I want to highlight. Hopefully the diamond pattern is obvious to you. This pattern is usually associated with a change in trend. Keep in mind it formed over the course of one day, so I think it really only gives us an indication for Wednesday and nothing more. Price broke lower out of the diamond pattern in the last 20 minutes of trading Tuesday. So expect there to be downward pressure on the market Wednesday.


I noted three stocks last time which I thought would come under selling pressure this week. While the SPX was down 0.45% Tuesday, of those three stocks JPM was down 1.16%, UAL was down 2.51% and LVS was down 4.21%. Hopefully you were able to take advantage. Per the diamond pattern, I expect the bears to have an edge again on Wednesday.
Thanks,
Joe


Recent Comments