
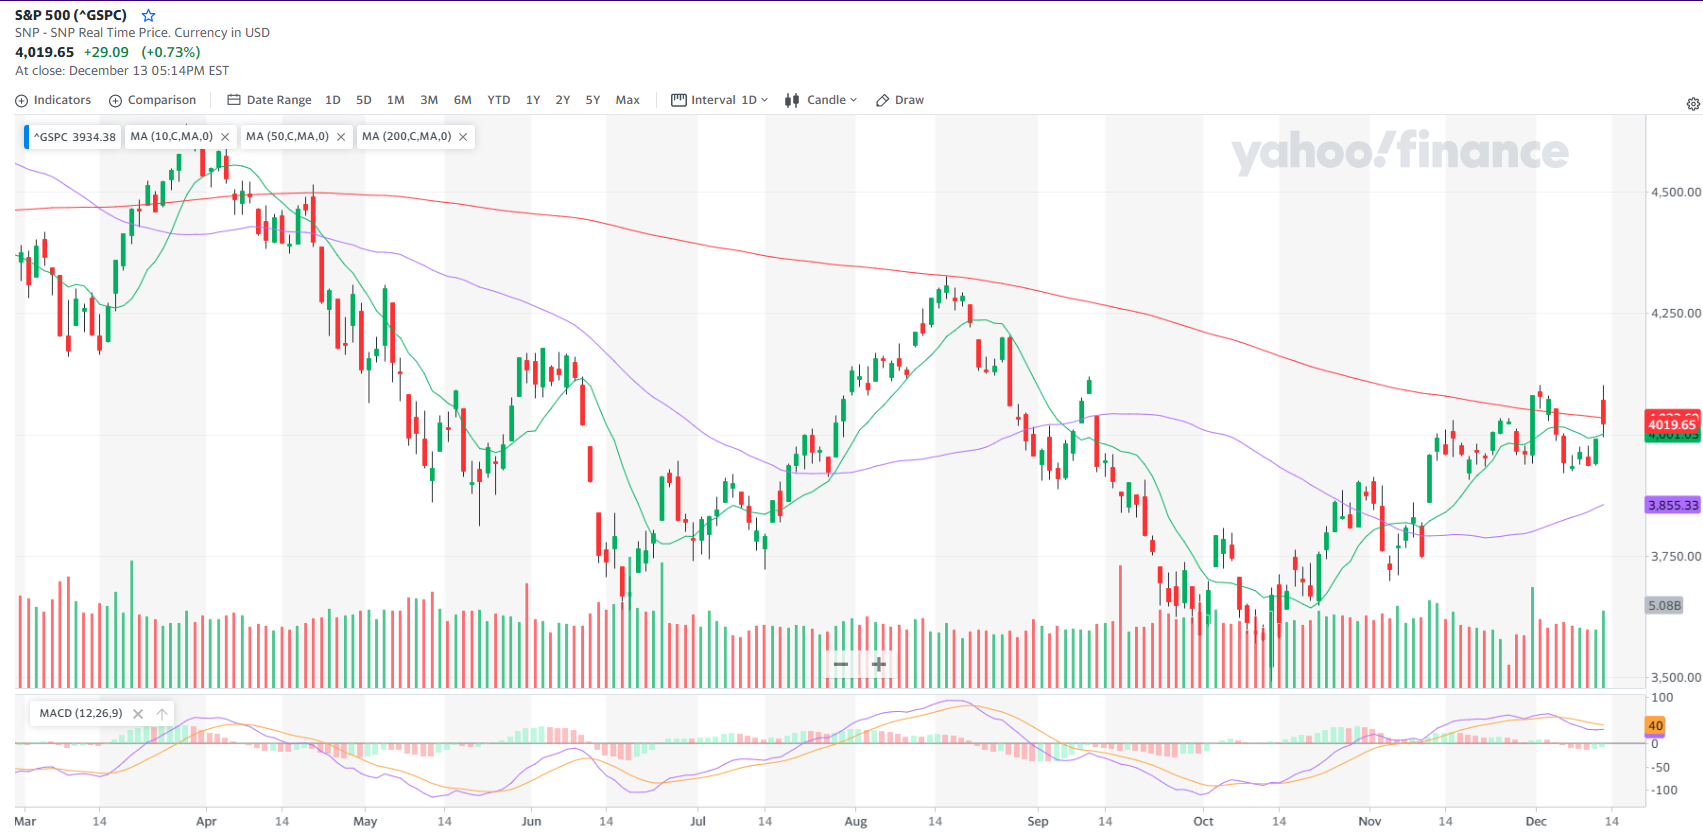
All of the major indexes were up yesterday, but it isn’t what you might think. Even though things gapped up after the news that inflation was slightly less than expected, markets gave most or all of it back throughout the day. If you take out the blip created by the gap, you see a downtrend that was previously having trouble breaking through its 10 day moving average still in tact. Take a look at the S&P and then see the next chart to spot an exception.
Keith Harwood has helped us learn how to find the outliers that are gong against the trend and setting up the best trades. Often these moves are overshadowed by the broader market but with a couple tricks the former market maker has helped us learn we can spot them again and again.
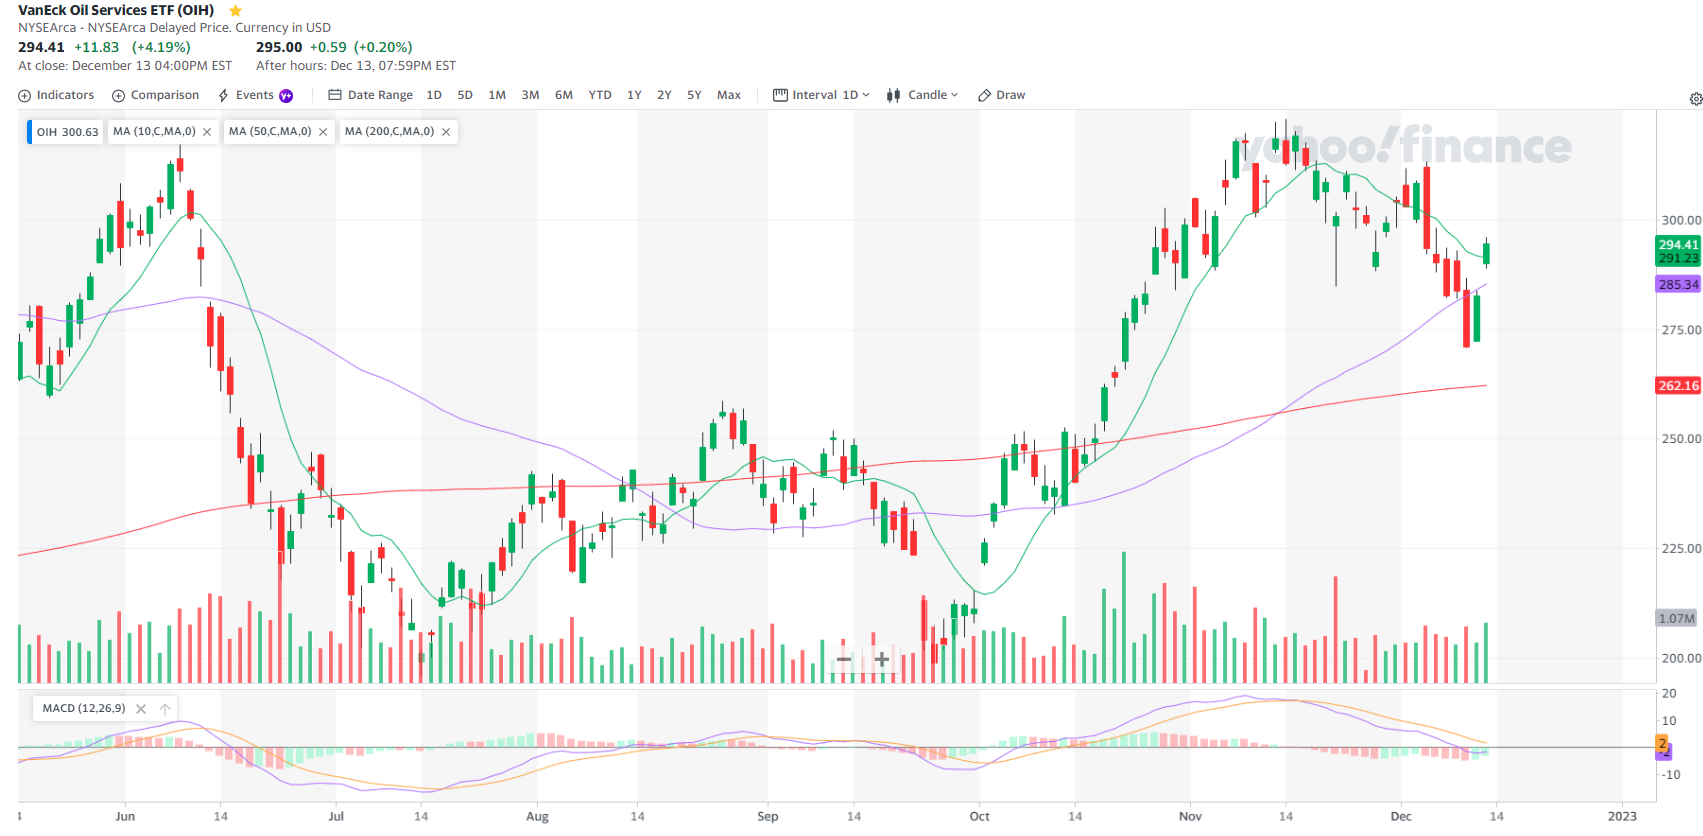

Oil was the exception as it did gap up but then continued moving up throughout the day. That curl up on the MACD is a sign that this move could continue to climb. If you are looking for other ways to spot the diamonds in the rough and make it easier to wade through the endless list of potential trades to get to the ones that a market maker would spot, check out Keith’s Outlier Road Map here.
Keep learning and trade wisely,
John Boyer
Editor
Market Wealth Daily


Recent Comments