
Here is a new way to look at one of our favorite stocks and a different way to use one of our favorite signals. We have looked at Dexcom many times in the past (check out those articles here) but usually from a more short term perspective. If you are looking for a longer term position and aren’t as interested in watching every single tick of the stock here is a great example of how to spot and entry and watch the long term trend.
DXCM rallied yesterday and confirmed a bullish MACD crossover. If you look at the chart from a short term perspective you can see that DXCM does this occasionally but the moves can still be elusive.


If your we completely dialed in and able to jump in the moment the signal flashed, you may have been able to grab these spikes. But if you got in even a little late, they just aren’t as much fun or could turn out to be costly.
But, if we look at this recent MACD crossover from a longer term perspective we can see that it is really just a confirmation of a longer trend that started last July. By pulling up a weekly chart it takes out some of the noise and shows a much clearer trend that started right after the split.
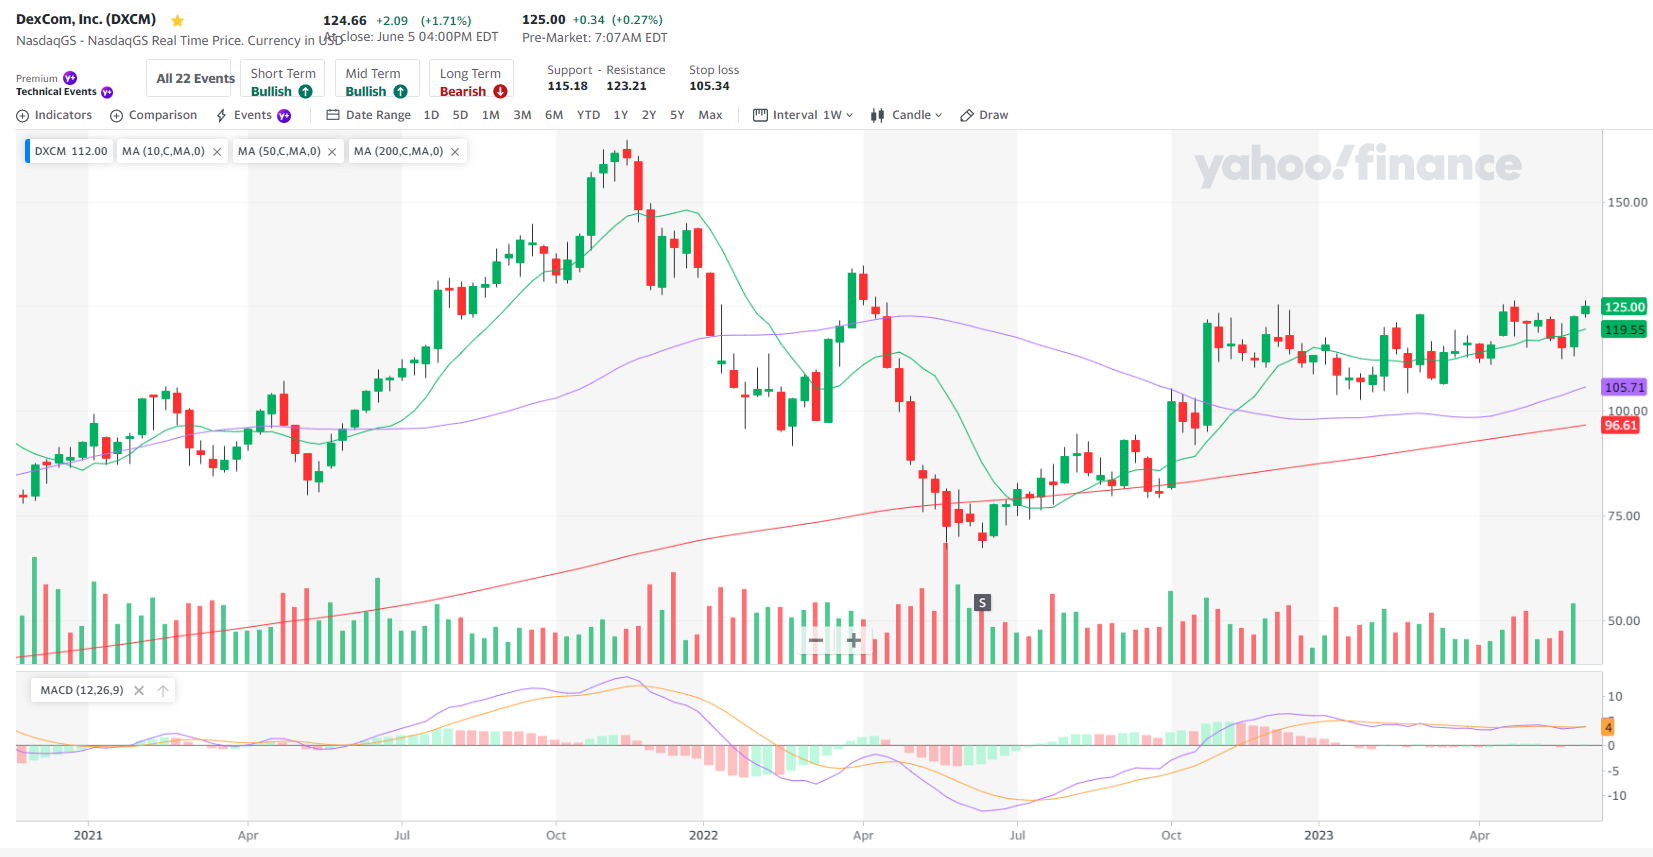
On the weekly, you get the bullish MACD crossover from a much lower starting point which is indicative of more potential momentum to the upside.
If you took the long term view with this stock, while the churn on the way up may have been unsettling, the payout would have been great.
Keep learning and trade wisely,
John Boyer
Editor
Market Wealth Daily


Recent Comments