
by Steve Swanson
You’ve no doubt been introduced to Exchange Traded Funds by now. Created in the mid-nineties, they are stocks designed to follow the movement of markets the way index funds do, through the buying and selling of the stocks which make up a particular index.
There are some important differences between an ETF and a mutual or hedge fund however. First, because an ETF trades like regular stock, you can buy and sell them anytime of the trading day, use margin, set stop losses, and watch their trading action tick by tick if you like. Second, there are no rules about how often you can trade them, no annual fees, and no waiting a day or more to get your order filled.
An ETF is essentially a stock that tracks and trades through a single share, all the stocks in the underlying index it follows.

Perhaps you have heard some caution regarding how ETF’s are good for short term trading, but are not suitable to be held long term, or that their end of day adjustments can diminish results. I always smile when I hear that, because as you’ll quickly see most of that talk is simply advisor chatter meant to dissuade investors from using ETF’s because after all, for the past decade, ETF’s have been cutting into fund profits in a significant way. So instead of listening to the noise of other’s self-interest, we’ll stick to facts in our discussion here which can be backed up with proven results – covering decades of time.
No Expertise Required
When it comes to your money, it’s critical to take an honest look at how much you are earning using current investment strategies versus what could reasonably be made with other approaches. And while one of the best ways to measure that is by simply comparing the returns of one investment strategy against another, it is also critical to consider how much expertise is going to be required by each strategy to achieve those returns.
Options for example, are powerfully leveraged instruments that can produce exceptionally high returns, but in reality, the amount of knowledge and trading expertise required to trade them profitably over the long term, is usually overlooked and far too often above the trading expertise of investors who dabble in them.
You Choose
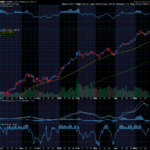
Let’s begin learning how to Triple Your Returns by starting with this one simple question: On the following graph, which of the three ETF’s representing six year returns for the S&P 500, would you have preferred to see in your portfolio?

The lowest line on the graph is the performance of the single beta ETF – the SPY, which tracks the S&P 500 index at a 1:1 ratio. If the S&P moves up 1% the SPY will also rally by 1% (it’s not perfect, but always very close). Contrarily, if the S&P is down 1%, the SPY should also fall by 1%.
Since the start of the bull market in March of 2009, the SPY climbed from $60 to a fantastic $209 over the next six and a half years, a gain of nearly 225% over that time. The important thing to remember is that SPY represents all 500 stocks of the S&P 500 index, and traded all by itself, the SPY is a single stock that acts like a fully DIVERSIFIED S&P fund!
Now let’s look at a how we could improve that return.
The next line on the chart (red) is a double beta ETF – the SSO. It also tracks the S&P 500, but leverages its return 2:1. – hence the reason it is referred to as “double beta”. At the start of the bull market the SSO was priced at $7 (adjusted for splits), and proceeded to climb to $68 by June of 2015. That’s a gain of nearly 725% – or triple the SPY!
Guess what just happened? Even though the SSO is only a DOUBLE beta stock, by using it you TRIPLED YOUR RETURNS on the S&P!
Did you have to use options to get those results? No. Did you use a margin account? No. Did your brain explode from learning all kinds of new strategies? No again!
All you did was the same thing a regular mutual fund investor would have done during the same time: buy the fund (the ETF stock in this case) and just sit on it for six and half years!
But without sounding trite, I’m going to show how it gets even better!
On the same chart, now let’s look at the incredible gains of the highest line (green) on the chart. That chart line represents the triple beta ETF – the SPXL, which tracks the S&P 500 too, but with a daily ratio of 3:1! In other words, when the S&P was up 1%, the SPXL was up 3%!
And note what happened over time for those who continued holding on to that ETF. For the same six and a half years of time, you would have earned a spectacular rate of return of nearly 1700%! That’s right, $10,000 would have become $170,000! Crazy what a small change in what we buy can do, isn’t it?
And notice, you didn’t have to understand anything more than to be an owner of the ETF while markets were going up, and a seller of them when markets top out.


Recent Comments