
Friday, August 14th, 2021
Happy Fabulous Friday!
I teach everyday people (like me) to trade options. I do my best to write in an understandable way as if we are talking over the kitchen table.
The Dow has been up two days and down one as I type on Wednesday. The charts of the indices are inching up and hitting new highs. Earnings reports continue this week.
For today’s Trade of the Day, we will be studying American International Group, Inc. (AIG). Searching for symbols today has been a challenge. Many equities have had their indicators flip directions with the daily swings in direction.
American International Group, Inc. provides insurance products for commercial, institutional, and individual customers in North America and internationally. The company’s General Insurance segment offers general liability, environmental, commercial automobile liability, workers’ compensation, casualty, and crisis management insurance products; commercial, industrial, and energy-related property insurance; and aerospace, political risk, trade credit, portfolio solutions, crop, and marine insurance.
American International Group, Inc. was founded in 1919 and is based in New York, New York.
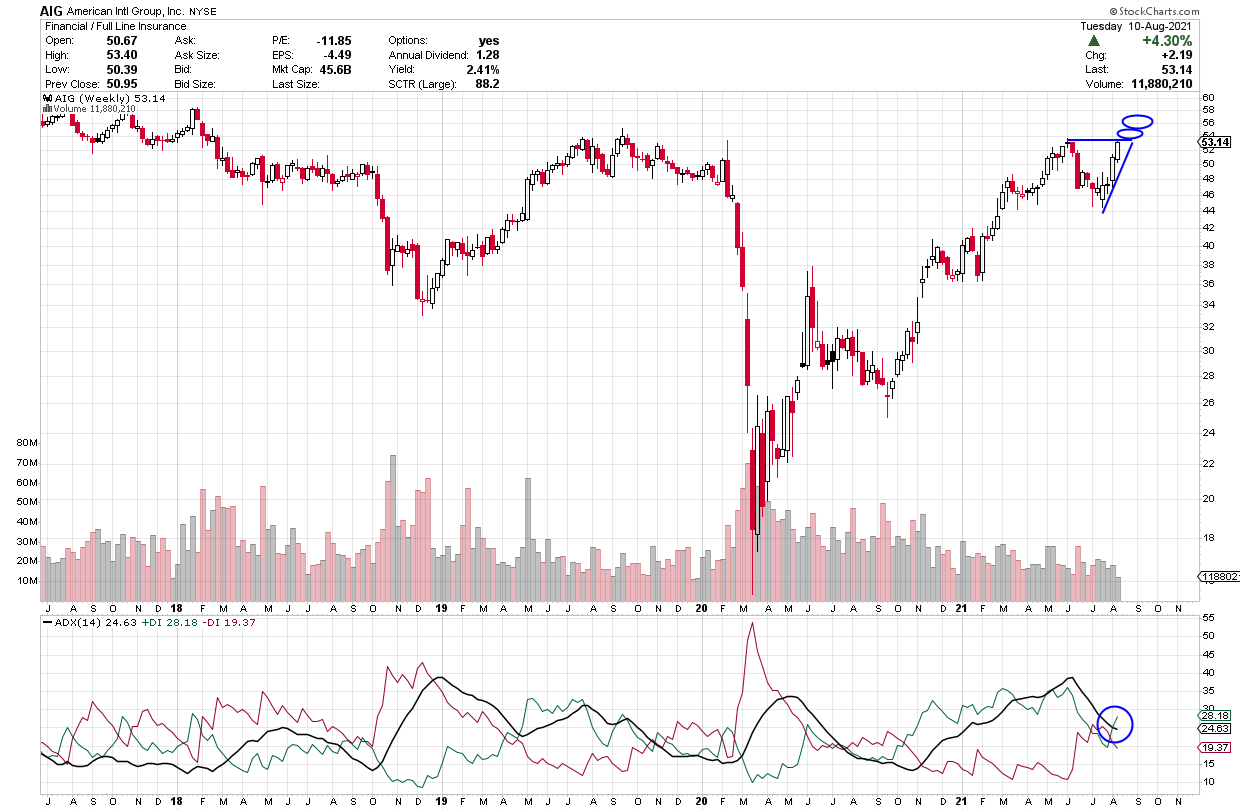
AIG continues rise this week and looks ready to head higher.
Let’s take a look at AIG weekly chart.
The ADX +DI (green line) is above the -DI and if it keeps heading up, the ADX line should turn up. As long as the +DI is above the -DI, price should rise. Green above red is an indication of strength. When the +DI is bullish and then the ADX turn up, it shows strength. If you want to learn more about ADX, read on or, if not, scroll down to the alert.

Average Direction Index (ADX) – Strength Indicator
The Average Directional Index consists of 3 lines: Green, Red and Black.
Green = +DI (Bullish)
Red = -DI (Bearish)
Black = ADX Strength Line
The DI line that is on top is in control. If the ADX line is heading up, strength is supporting the DI line that is on top and in control.
Check Out the Trade Alert Signal
Each candle on the chart represents price movement over a 5-day (week) period; therefore, it takes weeks for trades to play out. On the chart, the week is a bullish candle as I type. When the +DI crosses over the -DI line, it gives a buy signal [as the +DI line (green) appears as if it is in control and ready to head up on the ADX indicator, and if the ADX turns up that is even more bullish, suggesting an upward move is gaining strength. I’d like to see the green line to turn up to continue its upward bias and then the black line to turn up as well. When it also turns up will be great- all are bullish signs of strength. When the +DI crosses the ADX (black line) and when it rises, it shows a new burst of strength coming into the equity.
The Black ADX line is a strength line and if it flips up and continues to head up, it shows strength, and, once it happens, we will know strength will continue to flow into this equity. We will keep an eye on AIG over the course of the next few weeks.
If AIG’s price moves above $54, you could consider a trade. The short-term price target for AIG is $54 and then, perhaps, higher.
AIG Potential Trade – Showing Strength
This signal could give a quick payout if it continues its upward move, and the strength of this pattern continues. It looks as if it could push above $56.
To buy shares of AIG would cost approximately $54 per share and if it reaches its near-term target of $56 that would be a gain of $2.
This is a great example of the benefits of trading options. Let’s discuss this as a study case.
Option trading offers the potential of a lower initial investment and higher percentage gain. Let’s take a look and make a comparison.
The plus DI (green line) is above the -DI and if it stays above the -DI (red) line and rises above 54 by Friday a call trade can be considered.
If you buy 10 shares of AIG at $54, you will invest $540. If the stock increases in price to $56, you will earn a profit of $2 per share or $20 for the 10 shares or about 3.7%.
If you bought one option contract covering 100 shares of AIG with a Sept 3rd (Sept wk 1) expiration date for the $56 strike and premium would be approximately $.57 today or $57 per 100 share contract. If price increased to the expected $56 target or a gain of $2 over the next few weeks, the premium would likely increase $1 to $1.57 ($1 x 100 share contract = $100 Profit.) $100 profit on your $57 investment, this is an 175% gain. Nice! Terrific trade if it hits it target!
Trading options is a win, win, win opportunity. Options often offer a smaller overall investment, covering more shares of stock and potential for greater profits.
I like to stress when trading options, you don’t need to wait for the expiration date to close the trade. You can close anywhere along the way prior to the expiration date. It is never a bad idea to take profit.
Trading options is like renting stocks for a fixed period of time. The potential to generate steady income with options is real and it can be transforming. Watch this video to learn how you can use option trading to achieve financial freedom. click here
Yours For a Prosperous Future,
Wendy Kirkland

Past Equity Candidates:
Four weeks ago, we studied TWTR with a 75 strike, Aug 20 expiration and a premium of 3.35. It headed down with the pullback the last three weeks.
Three weeks ago, we looked at SPCE with Aug 20 expiration and a 37.50 strike with premium at 2.49. By Friday, the premium was about 1.70 versus 2.49 on Weds at possible entry. Since then, with the volatility premium has headed down. This has been a tough trading period.
Two weeks ago, we investigated DIS with Augst 20 expiration and 185 strike with a premium of 2.76. DIS did not pan out. The +DI crossed down again, closing the trade.
Last week, we discussed TLT with a 155 strike, Aug 27th expiration and .85 premium. It was down below then entry, so never resulted in a trade. Again, it has been a tough trading period where many equities have either pulled back or have gone sideways.


Recent Comments