Lately the headlines have been a mix of buzz about new record highs and warnings about a potential crash. So as a trader, how do you navigate this conflicted climate? There a a couple simple ways to spot a reversal that have had a high probability of success.
Many times the market will give you a warning that it is about to shift directions. Additionally, it will also give you signs that confirm the big move is not just a correction but a full on reversal or crash. Let’s start with the warning signs.
We all set mental expectations that act as warnings to tell us when it is really time to panic. I can feel a couple drops of rain, but if I can see the sun in the distance, I am not going to worry. If the sky is dark in the middle of the afternoon and I can hear thunder in the distance, its time to cancel the picnic.
Moving averages act as an indication of were the market as a whole has set those expectations. When we see a price break a shorter term moving average, like a 10 day or 10 period moving average, that is like the first couple drops of rain. It gives us a warning and alerts us to look up at the sky and even check the radar on the app on our phone.
Take a look at this chart of the Dow:
(chart below)

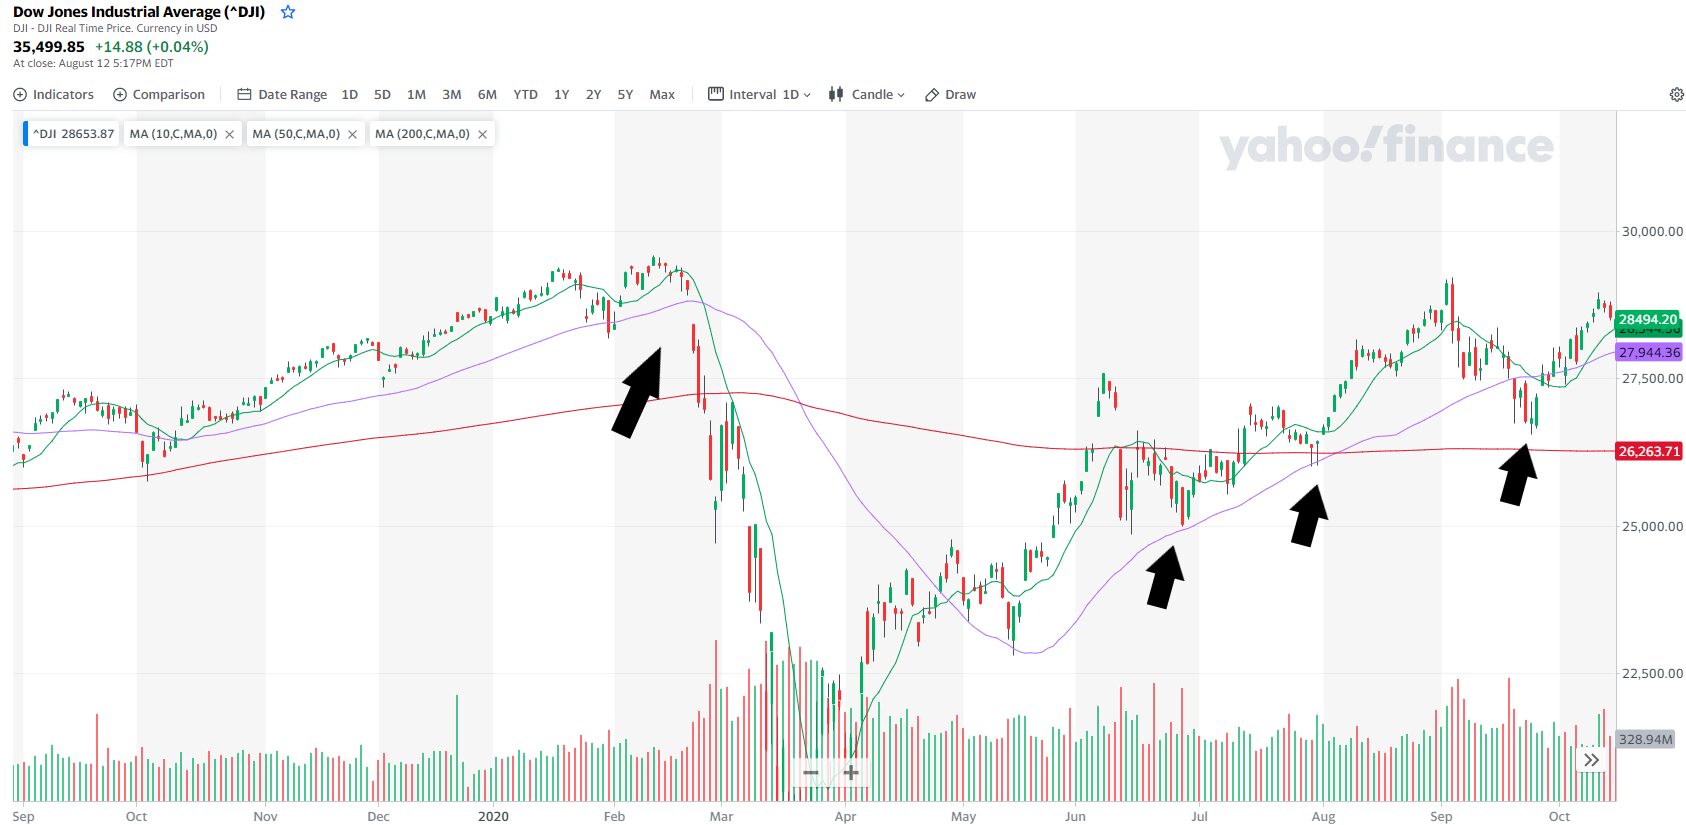
This shows the COVID Crash of 2020. You can see the first arrow on the left where the Dow breaks through the 10 day moving average (in green) and then gaps down below the 50 (purple) and continues through the 200 (red). If you saw that first move down and started paying attention, you could adjust your exit strategy a bit and keep a close eye on the market, Every move below the 10 day is not a crash but it does warrant attention.
When you see that gap straight through the 50 day, then the siren should be going off. That’s when you should sell some or most of your positions and start looking a getting in the short side. When it breaks the 200 then you can’t kid yourself and try to say it is going to bounce, get totally out and go short.
You can see that after the crash (when many, many experts were calling for a second crash) support was found at the 50 day. Even if you got back in when it broke the 50 in Sept, you could have gotten back in after the bounce was confirmed as it moved back above the 50.
Now take a look at where we are today:
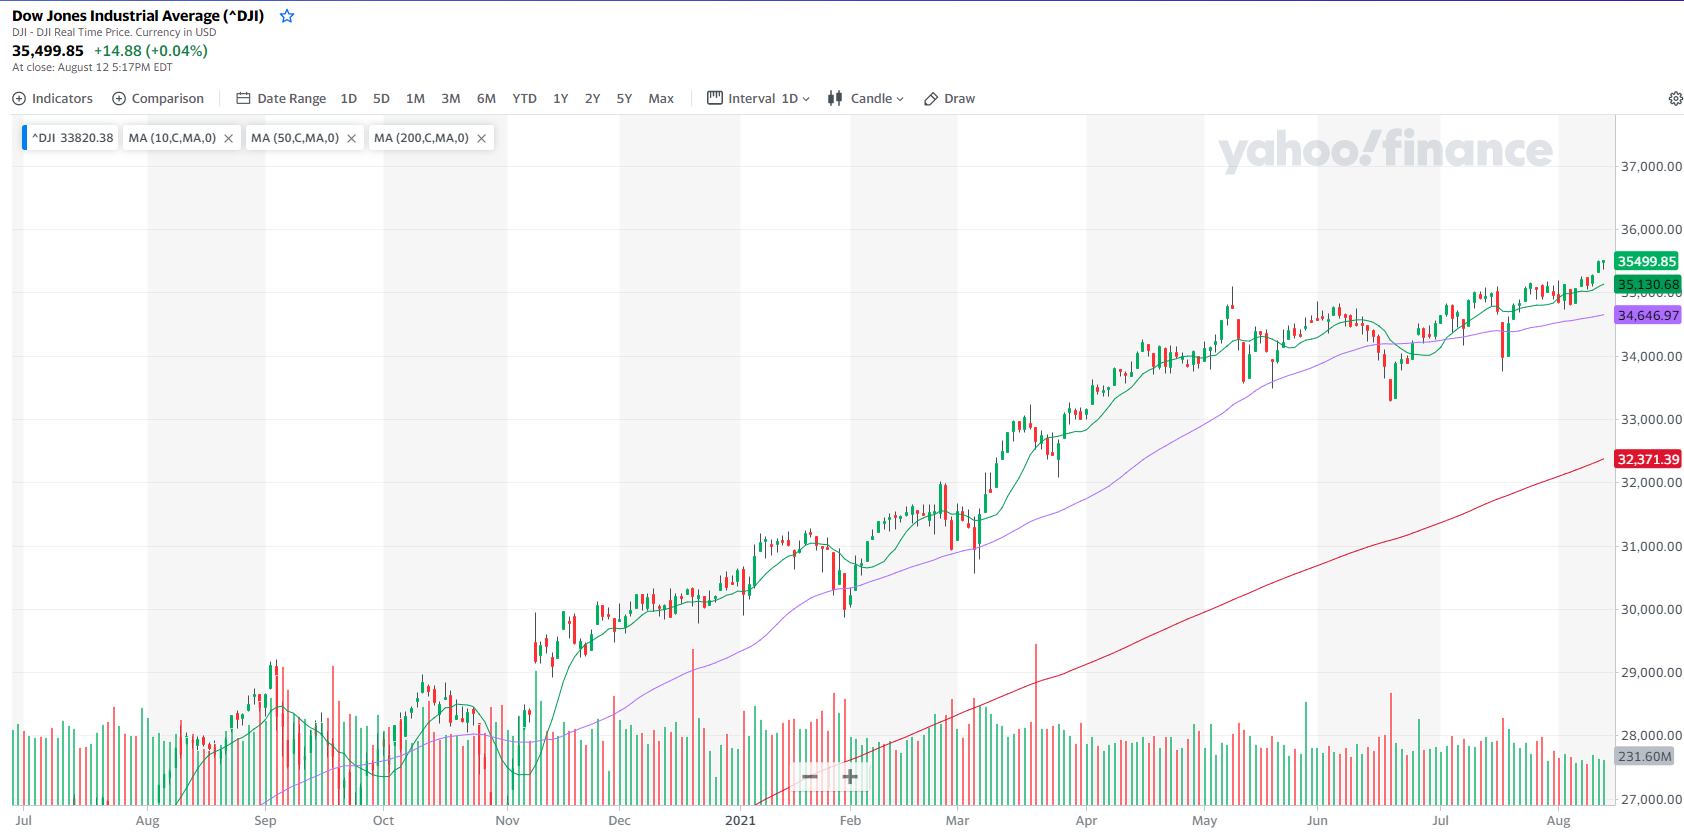
We have tested the 50 day a couple times, but the momentum upward is holding strong. The number of experts warning of another crash is starting to grow. But if you know what to look for, you can tell when the market is finally getting exhausted and you can be ahead of the move. I wouldn’t cancel the picnic, but I definitely would bring an umbrella.
Lee Gettess has some of the best tools for spotting market exhaustion and they work with uncanny accuracy at seeing reversals early. Take a look at how he does it here.
Keep learning and trade wisely,
John Boyer
Editor
Market Wealth Daily


Recent Comments