
This market correction is different. A key signal is telling us this is going to go farther down and at a faster clip than we have seen in the recent past. We have seen pullbacks in this rally before. Take a look at the SPY:
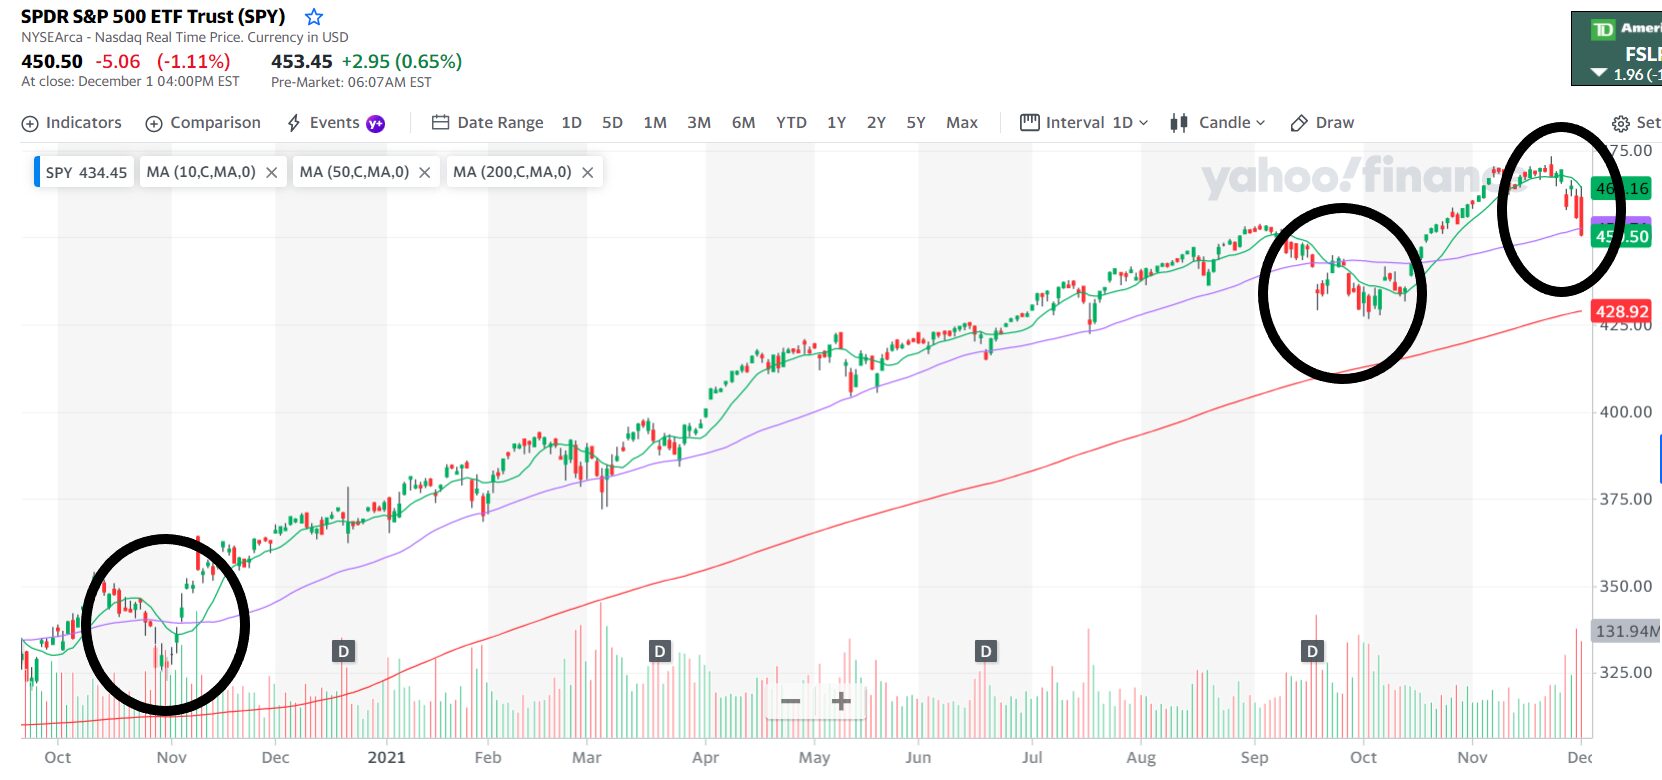
It has broken below its 50 day moving average a couple times in this rally but it hovered for a bit and then refilled to the previous trend. But a couple things are different. For starters, in the circle to the right, the current pullback, look at the size of the red bars. That is a serious tug from the bears yanking this move off its trend. But take a look at this chart below:

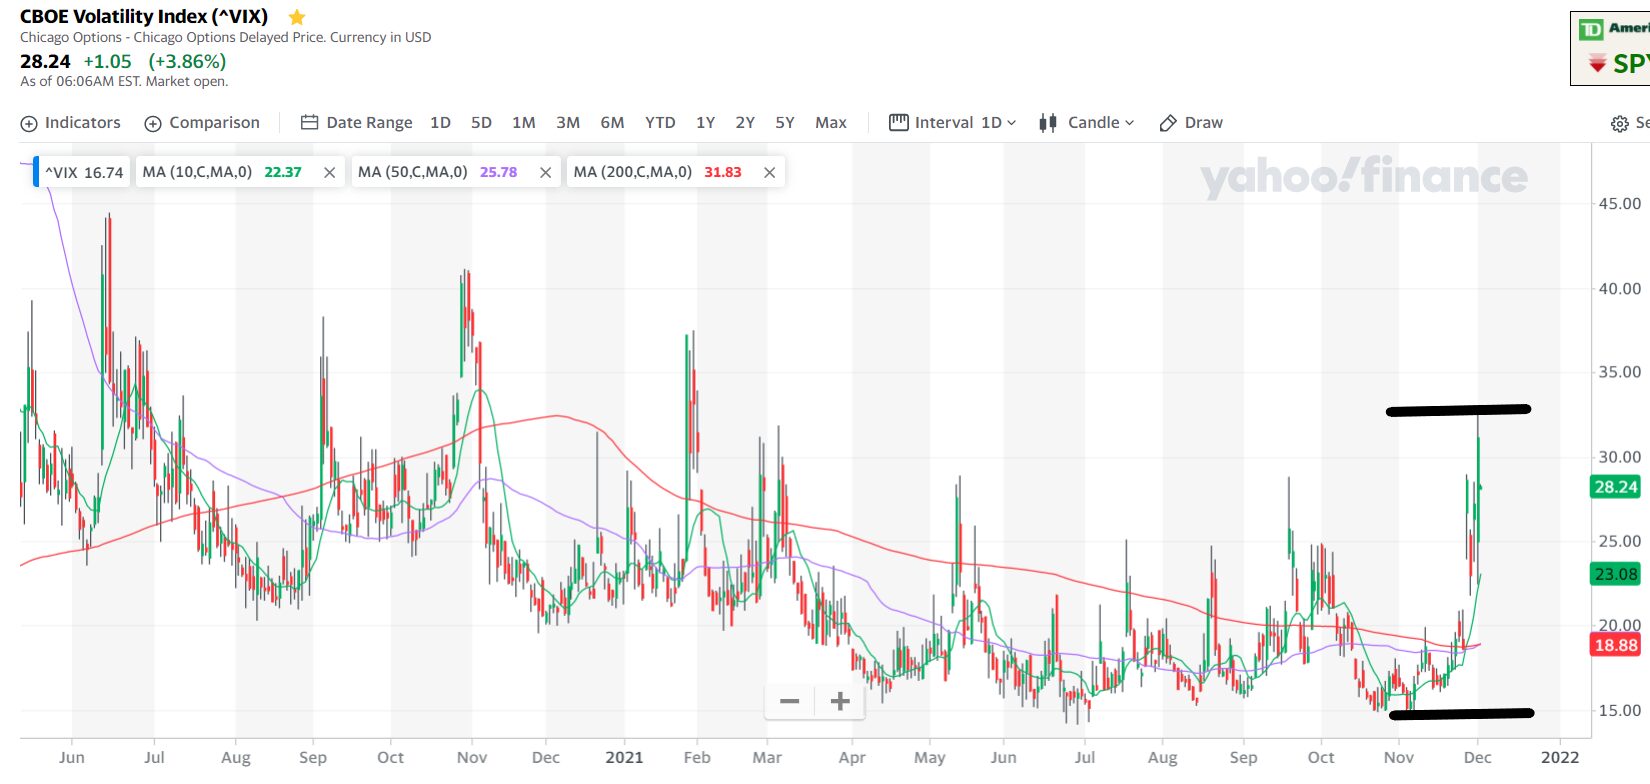
This latest move in the VIX which measures volatility is the biggest relative move we have seen since the COVID crash. Sure it has spiked in the past in relation to pullbacks in the market but this latest move has seen it double in just a couple weeks.
The key difference we are seeing in this latest move is aggressive momentum. A good tool to use to trade this kind of rapid pullback is an inverse ETF. These trade very similar to stocks but go up when the index is going down. Consider using SPXU which is a leveraged inverse ETF which does the same but has 3x leverage and triples the rate of the move.
To get a sense of how much more of a drop we will see take a look at Joe Duffy’s Little Black Book of Momentum Setups. It reveals reliable patterns that show how momentum is continuing or running out of steam.
Keep learning and trade wisely,
John Boyer
Editor
Market Wealth Daily
PS-If you want to see Joe show you how his powerful momentum tools work and how you can take advantage of them, be sure to catch his webinar next Wednesday. You can secure your spot here.


Recent Comments