
Happy Fabulous Friday!
I teach everyday people (like me) to trade options. I do my best to write in an understandable way as if we are talking over the kitchen table.
The Dow has been negative 2 days in a row as I type on Wednesday. This week the Nasdaq reached new all-time highs, while the daily chart of the Dow has been heading down, showing bearish.
[mstock id=”4287″]
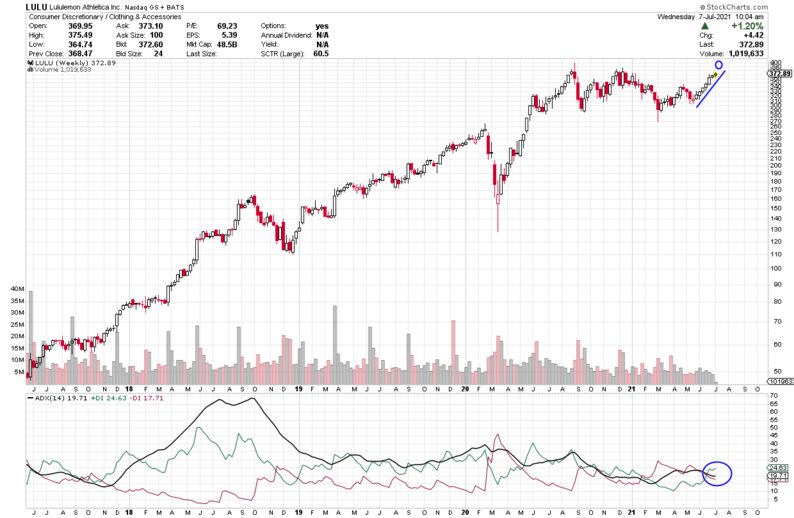
For today’s Trade of the Day, we will be studying lululemon athletica, inc., symbol (LULU). I have discussed LULU in the past. We actually discussed a trade that will expire July 16th. The premium for that trade went from 10.45 to 32.20 and still has a week and a half to go. LULU pulled back in April through the first weeks of May. It has been slowly rising since then and appears as if it will continue to rise.
Before analyzing LULU’s chart, let’s take a closer look at the company.
lululemon athletica inc., together with its subsidiaries, designs, distributes, and retails athletic apparel and accessories for women and men. It operates through two segments, Company-Operated Stores and Direct to Consumer. The company offers pants, shorts, tops, and jackets for healthy lifestyle and athletic activities, such as yoga, running, and training, as well as other sweaty pursuits. It also provides fitness-related accessories. The company sells its products through a chain of company-operated stores; outlets and warehouse sales; a network of wholesale accounts, such as yoga studios, health clubs, and fitness centers; temporary locations, including seasonal stores; and license and supply arrangements, as well as directly to consumer through mobile apps, and lululemon.com e-commerce website.
lululemon athletica inc. was founded in 1998 and is based in Vancouver, Canada.
LULU has risen this week and looks ready to head higher after smaller moves the last two weeks.
Let’s take a look at LULU’s weekly chart.
The ADX +DI (green line) is heading up and rising further and the ADX line looks ready to turn up. As long as it is above the -DI, price should rise. Green above red is an indication of strength. When the +DI being in charge is bullish and the ADX turning up shows strength. If you want to learn more about ADX, read on or, if not, scroll down to the alert.
Average Direction Index (ADX) – Strength Indicator
The Average Directional Index consists of 3 lines: Green, Red and Black.
Green = +DI (Bullish)
Red = -DI (Bearish)
Black = ADX Strength Line
The DI line that is on top is in control. If the ADX line is heading up, strength is supporting the DI line that is on top and in control.
Check Out the Trade Alert Signal
Each candle on the chart represents price movement over a 5-day (week) period; therefore, it takes weeks for trades to play out. On the chart, the week has risen in a nice string of upward moves. When the +DI crosses over the -DI line, it gives a buy signal [as the +DI line (green) appears as if it is in control and ready to head up on the ADX indicator], and if the ADX turns up that is even more bullish, suggesting an upward move is gaining strength. I’d like to see the green line to continue its upward bias and then the black line to turn up as well. When it also turns up will be great- all are bullish signs of strength. When the +DI crosses the ADX (black line) and when it rises, it shows a new burst of strength coming into the equity.
The Black ADX line is a strength line and as long as it flips up and continues to head up, it shows strength, and, once it happens, we will know strength will continue to flow into this equity. We will keep an eye on NIO over the course of the next few weeks.
The short-term price target for LULU is $390 and then, perhaps, higher.
LULU Potential Trade – Showing Strength
This signal could give a quick payout if it continues its upward move, and the strength of this pattern continues. It looks as if it could push above $390.
To buy shares of LULU today would cost approximately $376 per share and if it reaches its near-term target of $390 that would be a gain of $14.
This is a great example of the benefits of trading options. Let’s discuss this as a study case.
Option trading offers the potential of a lower initial investment and higher percentage gain. Let’s take a look and make a comparison.
The plus DI (green line) has crossed and if it stays above the -DI (green) line by Friday:
If you buy 2 shares of LULU at $376, you would invest $752. If the stock increased in price to $390, you would earn a profit of $14 per share or $28 for the 2 shares or about 3.7%.
If you bought one option contract covering 100 shares of LULU with a Aug 6 (Aug wk1) expiration date for the $390 strike and premium would be approximately $5.35 today or $535 per 100 share contract. If price increased to the expected $390 target or a gain of $14 over the next few weeks, the premium would likely increase $10 to $15.35 ($10 x 100 share contract = $1,000 Profit. $1,000 profit on your $535 investment, this is a 187% gain. Nice! Terrific trade if it hits it target!
Trading options is a win, win, win opportunity. Options often offer a smaller overall investment, covering more shares of stock and potential for greater profits.
I like to stress when trading options, you don’t need to wait for the expiration date to close the trade. You can close anywhere along the way prior to the expiration date. It is never a bad idea to take profit.
Trading options is like renting stocks for a fixed period of time. The potential to generate steady income with options is real and it can be transforming.
Yours for a Prosperous Future,
Wendy Kirkland
PS-I have created this daily letter to help you see the great potential you can realize by trading options. Being able to recognize these set ups are a key first step in generating wealth with options. Once you are in a trade, there is a huge range of tools that can be used to manage the many possibilities that can present themselves. If you are interested in learning how to apply these tools and increase the potential of each trade, click here.
Past Equity Candidates:
Six weeks ago, we observed QQQ ETF. This week it has been up with lots of swings but still reached an all-time high. It is currently at 360 which is above its 340 strike and July 16th expiration. The suggested premium of 2.25 is now at 20.50 per share or a 811% gain.
Five weeks ago, we checked out Boeing (BA). It went as high as 256.31 and then pulled back. It is currently at 240. It has a 270 strike and July 16th expiration. It needs to kick it in gear.
Four weeks ago, we looked at EA’s 150 strike with a July expiration. It went as high as 148.93 and then pulled back the last two weeks. Currently at 148.50. It needs to shift gears.
Three weeks ago, we studied Twitter (TWTR). It has a 65 strike and July expiration, its 1.10 premium rose to 5.20 today, which is almost 5 times what was paid or 430% gain.
Two weeks ago, we looked at ETSY’s July 23 expiration on 190 strike, paying 5.80 premium. Today it has a gain but lower than where it was. It is at 8.35 but was as high as 10.00, a nice gain in two weeks.
Last week, we zeroed in on NIO. It has moved down instead of up and has lost value. It had a 65 strike with a July 23rd expiration with a .96 premium.


Recent Comments