
Markets continue to climb and while we have had a few pullbacks, they have been getting shaken off and the ascent continues. So the big question becomes how do you recognize a top?
There are tools you can use to tell you how likely a stock is to find a top and make a reversal. While each has its benefits and can be powerful, the best solution is to put all the pieces together. Occasionally, you will get mixed results. Some indicators showing it could continue to climb and others showing an impending drop.
But when all three start agreeing on what will likely happen, it is a pretty strong sign to get ready for a pullback.
Let’s look at an example.
(scroll down for the chart)
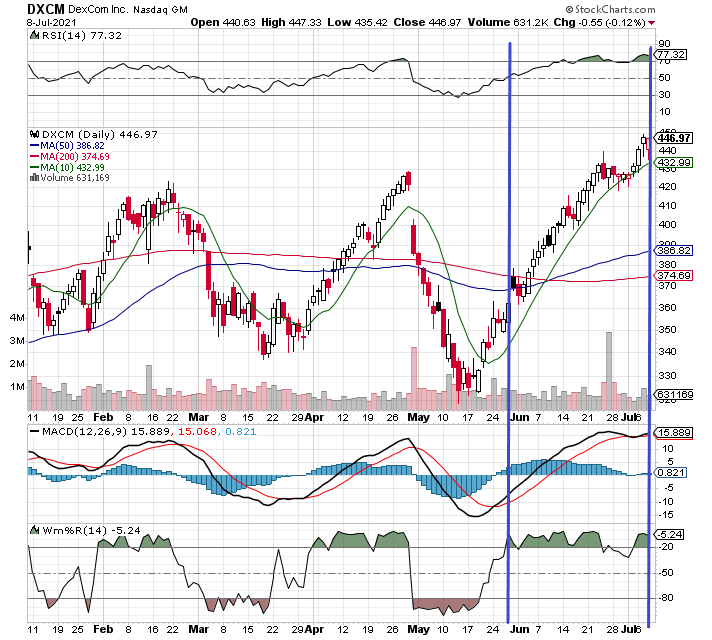
Dexcom (DXCM) has been on a tear since mid May. If you look at the indicators on the chart, you’ll see that at the first blue line, Williams %R (on the bottom of the chart) started flashing over bought and signaling a potential reversal. the stock did test its momentum to break back above the 50 and 200 day Moving Averages, but it ignored the sell signal and kept climbing. It is easy to say that indicators don’t work if you were just looking at that signal tool.
The MACD and RSI both took a little longer in the rally to show over bought, but now all three are in agreement and the potential for a sell off is pretty likely.
There is also one other key piece of information that is a clue about the likelihood of what will happen next with this stock.
(continued below)
The last earnings report for DXCM was on April 29. If you look at the chart, that is when the stock completely tanked. If you were simply using technicals and not paying attention to what else is going on with the company, you may have missed that and best just taken a hair cut. But, you also could have greatly increased the potential for loss by not putting all the tools to work.
Dexcom is due to release the next round of earnings in a couple weeks and we know the stock is heavily influenced by that information. This is an ideal opportunity to set up a spread and bin a position to cash in if it goes up or down.
Don Fishback has a great guide that helps recognize opportunities like this and find the option strategy with the highest statistical probability of being profitable. Be sure to grab his free guide that walks you through every step of his successful process.
Keep learning and trade wisely,
John Boyer
Editor
Market Wealth Daily


Recent Comments