
The reaction to Home Depot’s positive earnings news is weird. But you need to keep an eye on it.
HD announced it beat Q2 expectations and it is buying back a bunch of it’s stock. Both of those factors should result in a solid lift in the stock price. But the chart tells a different story. We looked at HD prior to the earnings call and it was showing signs of fatigue. (you can read that here) But after the call we see HD still not able to get solid upward energy. Take a look,
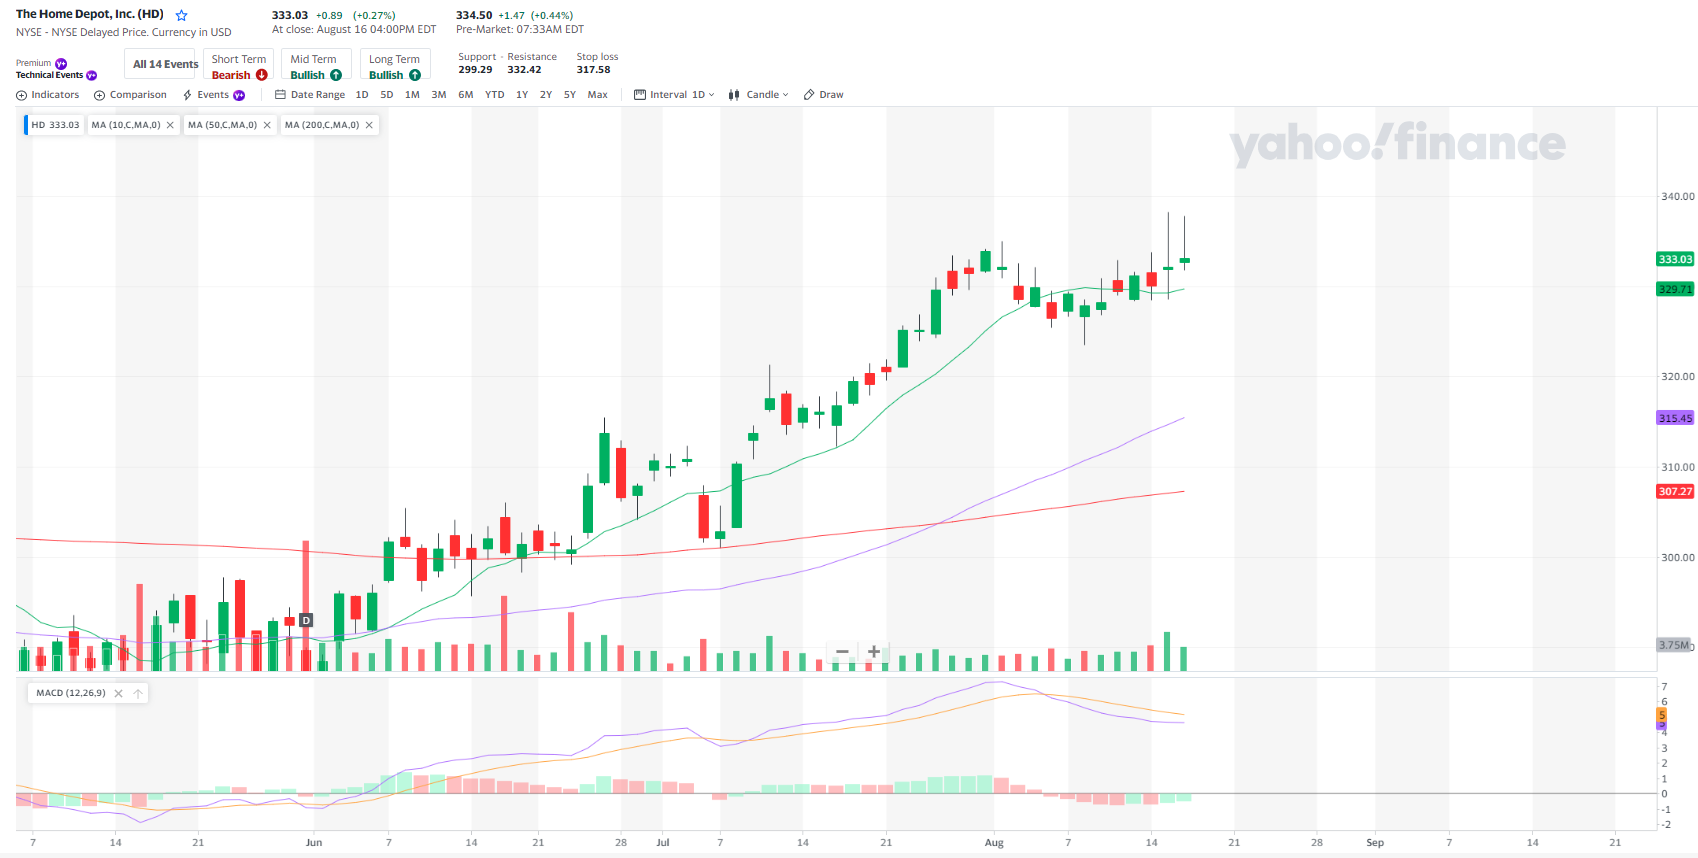
Those two last candles are called dojis. They usually signal a shift. But why isn’t it just going up?
We use candle charts to look at stocks regularly but if you aren’t sure how they work, here are the basics:
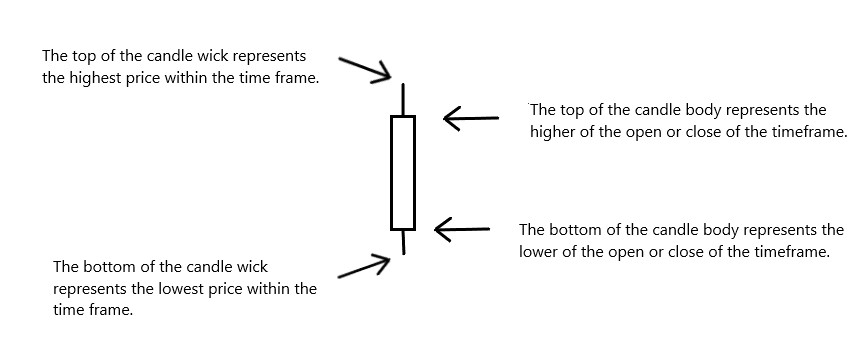
When you see a long wick with a very skinny body, that is a doji and it means that the bulls and bears are in a tug of war. The bulls pulled it up high at some point in the day and then the bears pulled it back down low to create the wick. But at the end of the day it ended up pretty close to where it started. Seeing two dojis in a row is an interesting sign. With all news pointing to a move up and then not seeing it happen, it may be that the broader market climate is just too much headwind for HD to make its move.
We will keep an eye on this to see how it plays out and what we can learn from it.
Keep learning and trade wisely,
John Boyer
Editor
Market Wealth Daily


Recent Comments