
| Tuesday, June 1st, 2021 |
| Airline Takes Flight |
Happy Thankful Tuesday!
I am excited to share that you don’t need special education or to sit in front of the computer all day to trade options. It can be easily learned if you are interested in spend an hour or so a week earning money in what could be considered “renting” stocks for a short period of time.
This is why I show you the details about an equity’s symbol and pattern each week.
I am typing this on Sunday, before the new week starts. Last week, the market four days out of five. Each day there were swings back and forth, but most of the days closed up recouping from the bearish swings.
For the updates on previously discussed symbols, please scroll down.
For today’s Trade of the Day, we will be looking at American Airlines, symbol (AAL).
Before analyzing AAL’s chart, let’s take a closer look at the company and its services.
American Airlines Group Inc., through its subsidiaries, operates as a network air carrier. The company provides scheduled air transportation services for passengers and cargo through its hubs, as well as through partner foreign gateways. As of December 31, 2020, it operated a mainline fleet of 855 aircraft.
The company was formerly known as AMR Corporation and changed its name to American Airlines Group Inc. in December 2013. American Airlines Group Inc. was founded in 1930 and is headquartered in Fort Worth, Texas.
Each candle on the chart represents price movement over a 5-day (week) period. The indicator at the bottom of the chart is a Channel Commodity Index (CCI).
I drew a line below the candles, if price drops below that line, it would be time to close. Watch for a continued rise toward its target.
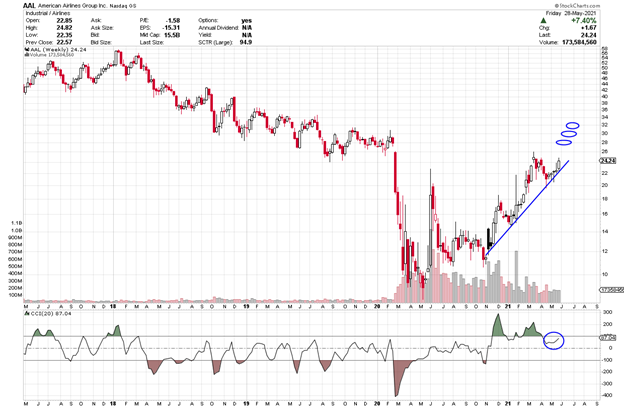

The cross above or a bounce off the CCI zero line is bullish, in that it is suggesting price has gone from bearish to bullish. A rise from the zero line up toward 100, suggests even more strength. If you want to learn more about the CCI, you can read through the short section below or you can scroll down to the alert signal.
Channel Commodity Index
A cross up and over the CCI -100 or the zero line can issue an entry signal as it moves from being bearish to bullish.
Also, a pullback and then, as it heads back up is another bullish indicator.
A break below the zero line means it has gone from bullish to bearish.
The Commodity Channel Index (CCI) is a versatile indicator that can be used to identify a new trend or warn of extreme conditions. Originally, it was developed to identify cyclical turns in commodities, but the indicator can be successfully applied to indices, ETFs, stocks and other securities. In general, CCI measures the current price level relative to an average price level over a given period. CCI is relatively high when prices are far above their average but is relatively low when prices are far below their average. In this manner, CCI can be used to identify overbought and oversold levels or breaks from one level to another.
Check Out How This Rise in Price Could Pay Out Big Time
AAL has turned bullish as it rises further above the zero line and toward 100. This week’s candle is apt to continue its upward movement that could take it higher. We are looking for a continued rise toward and then above 100 as it heads toward its price target.
If you find that you like the CCI Indicator as an easy-to-read indicator, it is included in the 5-Star Academy educational program which includes a chatroom where I am during the day to do live teaching sessions on M-W-F and to answer questions during the day. It is an incredibly supportive community.
Potential Profit Play for AAL
AAL’s price pulled back during April and it is starting an upward move last week. I am writing this on Sunday, if price rises when you receive this on Tuesday, you could consider a call option trade, if the CCI indicator remains above the zero confirmation and heading up.
Price is currently at approximately $24.50 as I write over the weekend and is expected to continue heading up to, perhaps, $28 and then, 30 and higher.
As long as the CCI line remains above the zero line and then, continues it move up toward the 100 line and then above, price will continue its current uptrend and should remain intact and continue to rise. We will keep an eye on AAL over the course of the next few weeks.
The short-term price target for AAL is $28 and, perhaps, $30, then higher.
To buy shares of American Airline (AAL) stock today would cost approximately $24.50 per share.
I am suggesting that the price of AAL may rise to $28.
Option trading offers the potential of a lower initial investment and higher percentage gain. It is like renting stock versus buying out right. Let’s take a look.
If you bought 30 shares of AAL at $24.50 or $735 and it increased in price to $28, it would gain $3.50 or $105 for the 30 shares or 14% profit. Not bad.
If you bought one call option contract covering 100 shares of AAL’s stock with a July 16th expiration date for the 28 strike, the premium would be approximately .53 per share or a total of $53 for the contract of 100 shares. If price increased the expected $3.50 over the next few weeks to $28 target, the premium would increase approximately $3.50 to $4.03. This is a gain of $350 on your $53 investment or 660%. That would be a terrific trade!
I want to remind you that you can sell to close and take profit any time along the line before the expiration date. You don’t have to hold the contract until expiration.
Options often offer a smaller overall investment, covering more shares of stock and potential for greater profits. This is like renting stocks versus having to pay full price to buy.
This said, if you are having any kind of trouble taking advantage of these trades, we don’t want you to miss out. I have put together programs that help traders just like you access the potential profits that options provide. Be sure to check out the programs (like 5-Star Academy mentioned earlier) shared in this email and we will make it easy for you to get your share.
I love to trade, and I love to teach. It is my thing.

PS-I have created this daily letter to help you see the great potential you can realize by trading options. Being able to recognize these set ups are a key first step in generating wealth with options. Once you are in a trade, there is a huge range of tools that can be used to manage the many possibilities that can present themselves. If you are interested in learning how to apply these tools and increase the potential of each trade, click here to learn more.

Previous Equities discussed:
Eight weeks ago, we examined Electronic Arts (EA). It pulled back a little from its weekly high to 142.92, but above last week. It has until June to climb to its 150 strike.
Seven weeks ago, we looked at Pfizer (PFE). It closed down last week to 38.93. The week before it moved up to 40.59 with a target of 39. Already its premium is more than doubled. The premium when it was listed was .39, on Sunday a week ago week it was 1.38. Super trade.
Six weeks ago, we looked at Tesla (TSLA). It seems as if its chart is back testing the zero line of CCI. I mentioned that it would remain viable as long as the CCI stays above zero. Two weeks ago, it failed by crossing below the zero line. Last week it started another upward move.
Five weeks ago, we checked out CRM. Last week it rose to 238.10 and has a 240 strike and a June 18th expiration.
Four weeks ago, we zeroed in on Bausch Health (BHC). It moved up last week it closed at 30.95. It has until June 18th to reach 35 strike.
Three weeks ago, we checked out JP Morgan (JPM). It rose to a high of 165.50 and pulled back to 162.66. It has a 170 strike and a June 18th expiration date.
Two weeks ago, we looked at Regeneron (REGN). Last week it pulled back .85% to 502.43 It still looks okay. It has until June to reach the 560 strike.
Last week, we viewed Boeing, (BA) and it rose as high as 252.60 and the pulled back to close at 247.02. It had a 250 strike and July 16th expiration. Its 6.80 premium doubled and is currently at 10.50.


Recent Comments