
| Friday, May 28th, 2021 |
| NASDAQ Fund Declares Bullish Sentiment |
Happy Fabulous Friday!
I teach everyday people (like me) to trade options. I do my best to write in an understandable way as if we are talking over the kitchen table.
The week has been positive for 3 days in a row without as much volatility as we have been seeing in the past weeks. One of the benefits of trading weekly chart patterns is that it cuts out a lot of the back and forth movement and focuses on longer term patterns.
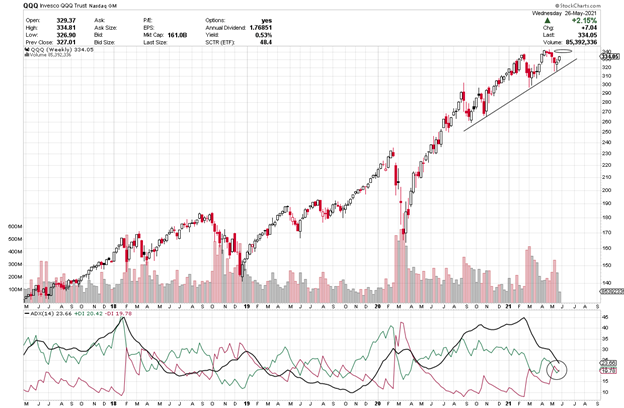
For today’s Trade of the Day, we will be studying the Nasdaq ETF (QQQ). It has pulled back a bit and looks as it will go higher.
Before analyzing QQQ’s chart, let’s take a closer look at the fund.
Invesco QQQ is an exchange-traded fund based on the Nasdaq-100 Index® . The Fund will, under most circumstances, consist of all of stocks in the Index. The Index includes 100 of the largest domestic and international nonfinancial companies listed on the Nasdaq Stock Market based on market capitalization. The Fund and the Index are rebalanced quarterly and reconstituted annually.
It is comprised of stocks we all recognize like Apple, Microsoft, Google and other technology stocks. in some ways, it seems to be a little more trendy than the S&P.
QQQ has risen the last 2 weeks after a four week drop and looks ready to head higher.
Let’s take a look at QQQ’s weekly chart.
The +DI (green line)is just now crossing up. As long as it is above the -DI, price should rise. Green above red is an indication of strength. The +DI being in charge is bullish and the ADX turning up shows strength. If you want to learn more about ADX, read on or, if not, scroll down to the alert.

Average Direction Index (ADX) – Strength Indicator
The Average Directional Index consists of 3 lines: Green, Red and Black.
Green = +DI (Bullish)
Red = -DI (Bearish)
Black = ADX Strength Line
The DI line that is on top is in control. If the ADX line is heading up, strength is supporting the DI line that is on top and in control.
Check Out the Trade Alert Signal
Each candle on the chart represents price movement over a 5-day (week) period; therefore, it takes weeks for trades to play out. On the chart, 2 weeks have risen in May. When the +DI crosses over the -DI line, it gives a buy signal [as the +DI line (green) appears as if it is in control and ready to head up on the ADX indicator], and if the ADX turns up that even more bullish, suggesting an upward move is gaining strength. I’d like to see the green line to continue its upward bias and then the black line to turn up as well. When it also turns up will be great- all are bullish signs of strength. When the +DI crosses the ADX (black line) and when it rises, it shows a new burst of strength coming into the equity.
The Black ADX line is a strength line and as long as, it continues to head up, it shows strength, and, once it happens, we will know strength will continue to flow into this equity. We will keep an eye on ABBV over the course of the next few weeks.
The short-term price target for QQQ is $340 and then, perhaps higher.
QQQ Potential Trade – Showing Strength
This signal could give a quick payout if it continues its upward move and the strength of this pattern continues. It looks as if it could push above $340.
To buy shares of QQQ today would cost approximately $335 per share and if it reaches its near term target of $340 that would be a gain of $5.
This is a great example of the benefits of trading options. Let’s discuss this as a study case.
Option trading offers the potential of a lower initial investment and higher percentage gain. Let’s take a look and make a comparison.
If the plus DI (green line) stays above the -DI (green) line by Friday:
If you bought 2 share of QQQ at $335, you would invest $670. If the stock increased in price to $340, you would earn a profit of $5 per share or $10 for the 5 shares or about 2%.
If you bought one option contract covering 100 shares of QQQ with a July 16th expiration date for the $340 strike and premium would be approximately $6.49 today or $649 per 100 share contract. If price increased to the expected $340 target or a gain of $5 over the next few weeks, the premium would likely increase $5 to $11.49 ($5 x 100 share contract = $500 Profit. $500 profit on your $649 investment, this is a 77% gain. Nice! Terrific trade if it hits it target!
Trading options is a win, win, win opportunity. Options often offer a smaller overall investment, covering more shares of stock and potential for greater profits.
I like to stress when trading options, you don’t need to wait for the expiration date to close the trade. You can close anywhere along the way prior to the expiration date. It is never a bad idea to take profit.
Trading options is like renting stocks for a fixed period of time. The potential to generate steady income with options is real and it can be transforming. Watch this video to learn how you can use option trading to achieve financial freedom. click here

PS-I have created this daily letter to help you see the great potential you can realize by trading options. Being able to recognize these set ups are a key first step in generating wealth with options. Once you are in a trade, there is a huge range of tools that can be used to manage the many possibilities that can present themselves. If you are interested in learning how to apply these tools and increase the potential of each trade, click here to learn more.

Past Equity Candidates:
Eleven weeks ago, we looked at Kellogg’s (K) It is at 66.09 as I type on Wednesday, surpassing its strike of 65 and then slipped to 65.60 It has until June 18th expiration.
Ten weeks ago, we discussed Nikola (NKLA) it has been up the last two weeks after pulling back. It has not done well at all. It has dropped below support levels. It is still way down below its expected target of 25 and has until June.
Nine weeks ago, we looked at AMZN Its expired in May.
Seven weeks ago, we examined MSFT. It moved as high as 260 well above its 255 target and it has a June expiration. Premium more than doubled. This week it is down well below its strike.
Six weeks ago, we looked at Peloton (PTON) and its plus DI line crossed down and negated the entry signal. Since then it had headed down. This happens sometimes. A symbol looks as if it is ready to head in a new direction and then, it turns on its heel and heads in the opposite direction. This why it is important to wait for a confirmation, or sell as soon as there is a reversal that negates the symbol. PTON headed up last week and this week, but it has a long way to go before it reaches the entry area again. Its strike was 135 with June expiration. It is at 109.56 and was one of the highest % movers up today.
Five weeks ago, we checked out AbbVie (ABBV) It was up and down this week, moving past its 115 strike and down to 114.70 with June 18th expiration. It moved as high as 117.90.
Three weeks ago, we studied Marathon (MARA). It dropped two weeks and now up a little to 25.36 toward its 40 strike.


Recent Comments