
Markets are soaring and with a nice boost from good jobs numbers today, they aren’t looking back. Unemployment numbers dipped for October and with people getting back to work, optimism abounds.
The S&P has seen one of the longest uptrends in years and is throwing and bearish expectations under the bus and using them for traction. The key here is how to keep grabbing the gains from this amazing run without getting crushed when it finally turns. Take a look at all the green on the right side of the chart below:
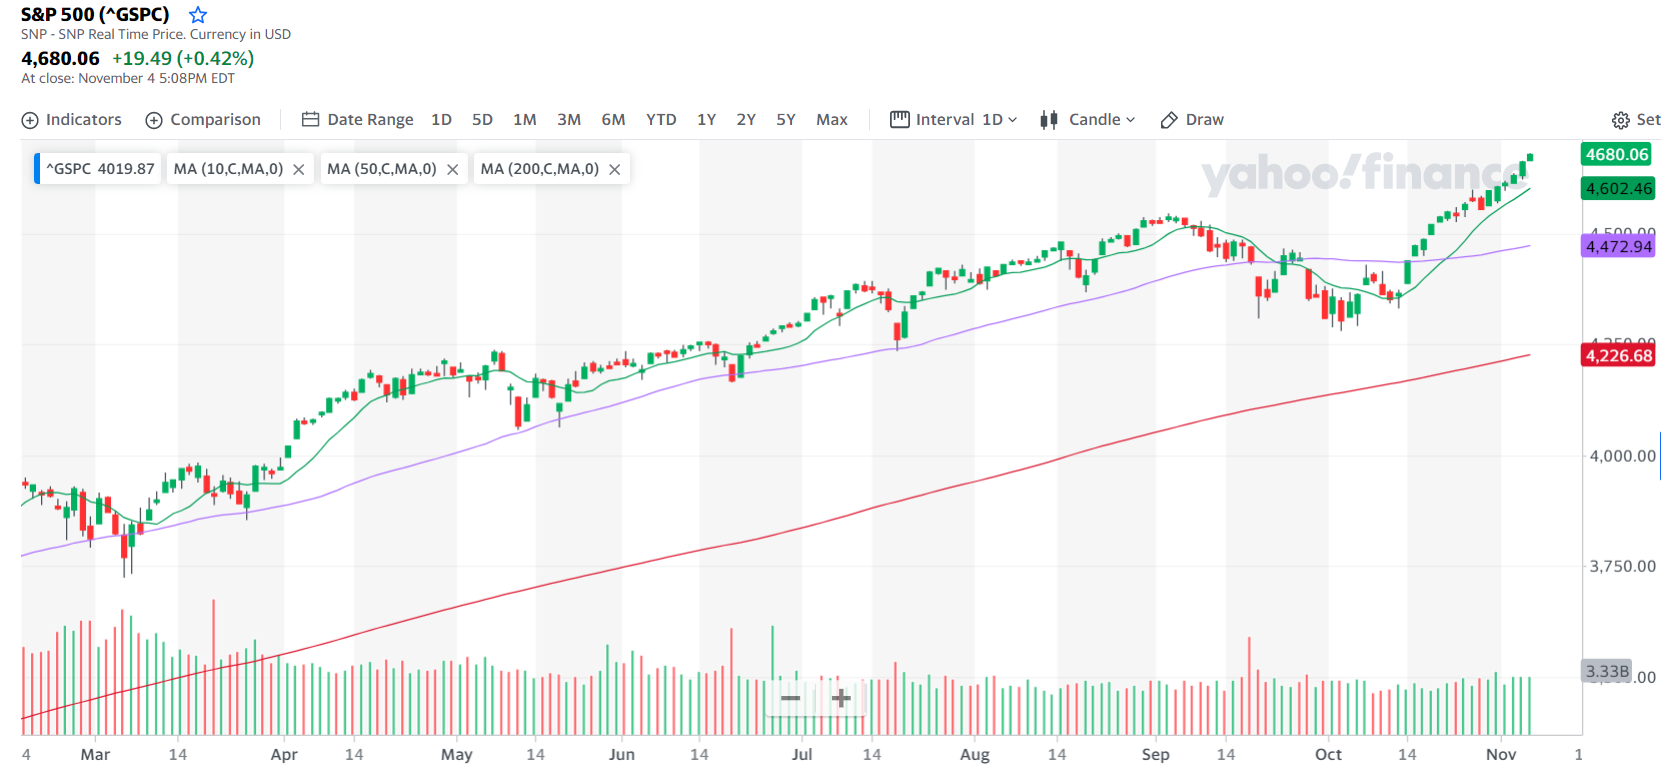

It is always easy to look at these charts and think the trend is obvious. But, when you are watching it play out, day by day, it can create some headaches. Was that a reversal from the correction or just a slight bounce? Will it turn back down at this next resistance point? It can’t keep going up, can it?
Knowing how to spot the signs of the momentum losing energy is the best way to pull the maximum profit out of a big move like this without making yourself nuts. Or more nuts.
Lee Gettess has really developed one of the best methods for letting the chart reveal when the momentum is getting exhausted. The best part is that he did all the hard work, heavy lifting, and extensive research to get it dialed in. If you want to be able to see the signs to tell you if the trend will keep going or it is time to sell, grab his book here.
Keep learning and trade wisely,
John Boyer
Editor
Market Wealth Daily
PS-Interested in live training with legendary trading champion Chuck Hughes? He has opened up a very limited number of seats in an exciting new program. If you’d like to get in on this rare opportunity, click here for more info.


Recent Comments