Thursday, September 9th, 2021
Happy Thriving Thursday!
I have put together a few articles about key indicators that I use often that are extremely helpful when you are identifying the symbols that are setting up for a big move. These indicators can also be very helpful when trying to identify a price target to use when building an option trade.
A great way to spot underpriced symbols is to use the True Strength Index or (TSI). It is designed to show how a stock is valued in relation to its current price. If a stock is overbought, meaning it is likely priced higher than it can support and has a high probability of a pullback TSI will be in positive territory. If it is oversold, meaning it is underpriced and not only is a bargain but is setting up to breakout to the upside, the TSI will be in negative territory.
The True Strength Index (TSI) is an oscillator that fluctuates between positive and negative territory. As with many momentum oscillators, the centerline defines the overall bias. The bulls have the momentum edge when TSI is positive and the bears have the edge when it’s negative. As with MACD, a signal line can be applied to identify upturns and downturns. Signal line crossovers are, however, quite frequent and require further filtering with other techniques. Chartists can also look for bullish and bearish divergences to anticipate trend reversals; however, keep in mind that divergences can be misleading in a strong trend.

TSI is somewhat unique because it tracks the underlying price quite well. In other words, the oscillator can capture a sustained move in one direction or the other. The peaks and troughs in the oscillator often match the peaks and troughs in price. In this regard, chartists can draw trend lines and mark support/resistance levels using TSI. Line breaks as well as line crosses can then be used to generate signals.
Take a look at an example of the TSI on a chart of the SPY:
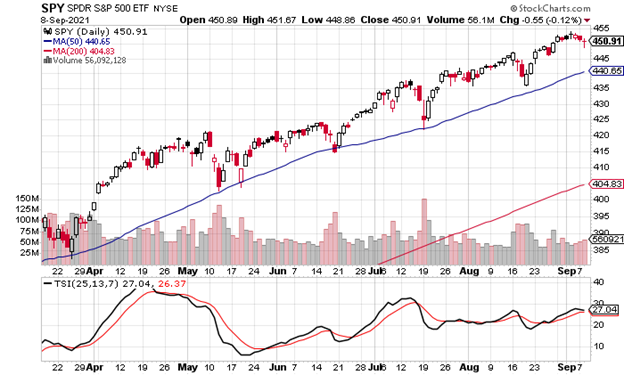
The TSI is positive at 27.04 which means it is in overbought territory. Also very important is that it is turning down. When you combine this with the fact that the each time SPY has turned down it has pulled back to the 50 Day Moving Average (the purple line on the chart above) for support. This tells us that it is likely the SPY will pullback to around 440. It will be important to watch the TSI (the black line on the bottom section of the chart) to see if it crosses below the red signal line and confirms the pullback.
These patterns and indicators can be extremely helpful in finding great trades that are about to make a big move. When you use that information and find an smart option trade you can combine high probability with maximum leverage to really accelerate your potential gains.
The TSI is an important tool in my Smart Paycheck program. If you are interested in learning more about it, scroll down and watch the video that explains it in detail.
I want to stress, when you trade options, you can close the trade anywhere along the line to take profit (or loss). You don’t have to wait until it hits the target or until expiration day.
You also want to wait for the indicator confirmation and don’t jump-the-gun with an early entry.
Trading options can be a win, win, win opportunity. Options often offer a smaller overall investment, covering more shares of stock and potential for greater profits.
What’s Next? I Can Hardly Wait!
Keep an eye on your inbox and I will keep sharing what I have my eye on. If you want to get deeper into how I find these winners, be sure to check out the programs in the banners in this message to learn more about options.
I love teaching and write my strategy books as clear as I write these emails. I try to think of the questions you’ll ask before you ask them. Sign up and join me in the profit potential.
Yours for a Prosperous Future,
Wendy Kirkland


Hello,
I am interested in the smart paycheck program, but I want to subscribe on a monthly basis.
Is that possible? If so please let me know how. Thanks